What is on the Property Details pages?
RPR’s property pages represent over 160 million parcels (public record data) nationwide, accessible to all REALTOR® members. Public record data includes owner information, property facts, legal description, plat maps, mortgage and tax data, deeds, prior sales transactions, and distressed data.
MLS data is then added through our partnership agreements. Each MLS decides if they would like to share their on and off-market listing data with members of other MLSs.
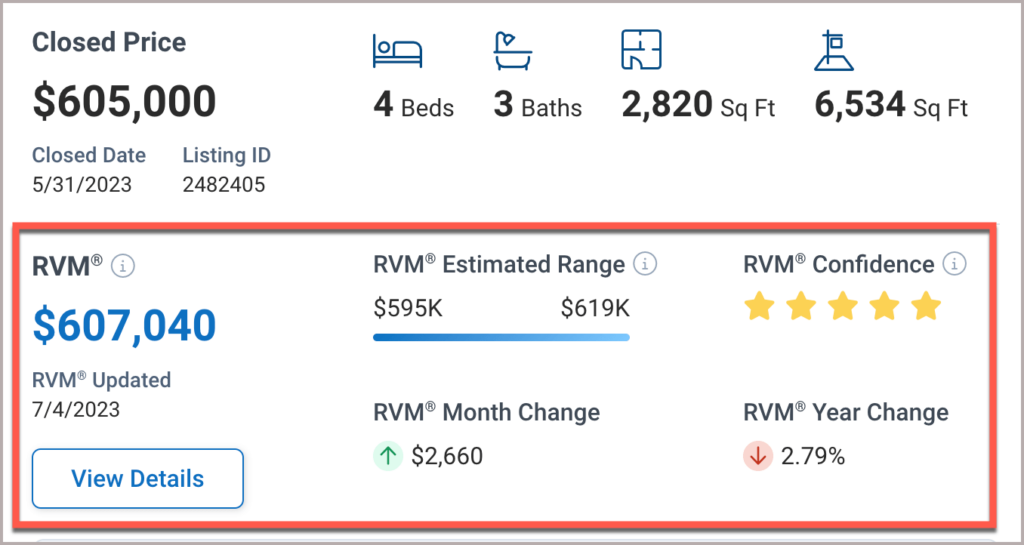
RVM®/AVM: Estimated values are available for single-family residences, condominiums, and smaller multi-family properties. Learn more about RVM® and AVMs.
Neighborhood Data: Click the Neighborhood tab to see stats and demographics about the housing, people, economics, and quality of life of the neighborhood. Learn about our Market Trends and demographic charts.
Seller’s Proceeds: Fill out a Seller’s Proceeds worksheet to estimate what the seller might make on a sale of the property. You can print it on its own or choose to include it in a Seller’s Report. See how to create a Seller’s Proceeds worksheet.
Create a CMA
Create a CMA using our 5-step wizard that walks you through the process to validate basic facts about a subject property, select comps, and adjust those comps to yield a customized CMA result. See how to create a CMA.
Refine the Value
Use our Refine Value tool to change the estimated value based on home improvements, needed improvements, and market and home conditions. Learn more about the Refine Value tool.
Analyze a Property
Analyze a property to see if it would be a good investment as a flip or as a long term hold using a real estate investment tool provided by Valuate®. See how to analyze a property.
Tab Descriptions
Click the links below for a brief description of each tab.
The Property Information tab includes an estimated value, listing data, property facts, school data, price change history, interior and exterior features, location details, owner facts, legal description, tax info, mortgage records, and more. You can also add notes, upload your own photo or fill out a Seller’s proceed worksheet.
At the top of the page are links that allow you to print the page, create a report, or save the property.
The Market Trends tab allows you to see the market trends for the area surrounding your subject property. Data to be drilled down by Property Type and one or more charts can be printed to create a report-like PDF.
Three or more transactions must occur within a calendar month to generate data for transaction-based charts. If no data appears on a chart, try searching within a larger area or select a different Property Type.
The Refined Value tab allows you to change the estimated value ( RVM®/AVM) based on adjustments to the basic facts, improvements, needed improvements, or market and home conditions. Learn how to use the Refine Value tool.
The CMA tab takes you to our five-step wizard where you will confirm the property facts, search for comps, make adjustments, then create a report. See how to create a CMA.
The Neighborhood tab includes charts and statistics about the housing, people, economics, and quality of life of the neighborhood.
In June 2022 we added charts that contain new categories and metrics and reformatted and improved our original charts. Data can be drilled down by Property Type to allow an in-depth examination of a market area. One or more charts can be printed to create a report-like PDF.
Frequently Asked Questions
RVM® estimated values include on-market and off-market listings from MLS data, in addition to publicly recorded sold data. An RVM® is a more accurate estimation than an AVM estimation. Learn more about RVM® and AVMs.
AVM estimated values draw solely from publicly recorded sold data. Learn more about RVM® and AVMs.
You can update the Property Facts in the Your Changes column on the Property Summary. Your changes will display in your reports, along with the Public Facts and Listing Facts.
The neighborhood or ZIP code is rated for walking access to POIs or Points of Interest (parks, restaurants, retail stores, etc.), weather, public transportation, and population density are also considered. The Overall Score is based on the availability of POIs and the distance and time to reach them. The Amenity Score reflects the walkability to POIs such as retail locations and salons. The Leisure Score reflects the walkability to POIs such as restaurants and parks. Scores range from 0-5 with 5 being the best. The data are provided by Precisely, an RPR data partner.
The Building Quality is determined by the county using their own evaluation methods. Not all counties provide a Building Quality rating.
Phone numbers that are on the National Do Not Call Registry will not be displayed.
Need Help?
If you need additional assistance, contact RPR Member Support at (877) 977-7576 or open a Live Chat from any page of the website.