What is the flood zone map data layer?
The Flood Zone map layer shows an area’s flood zone designation as determined by the Federal Emergency Management Agency (FEMA).
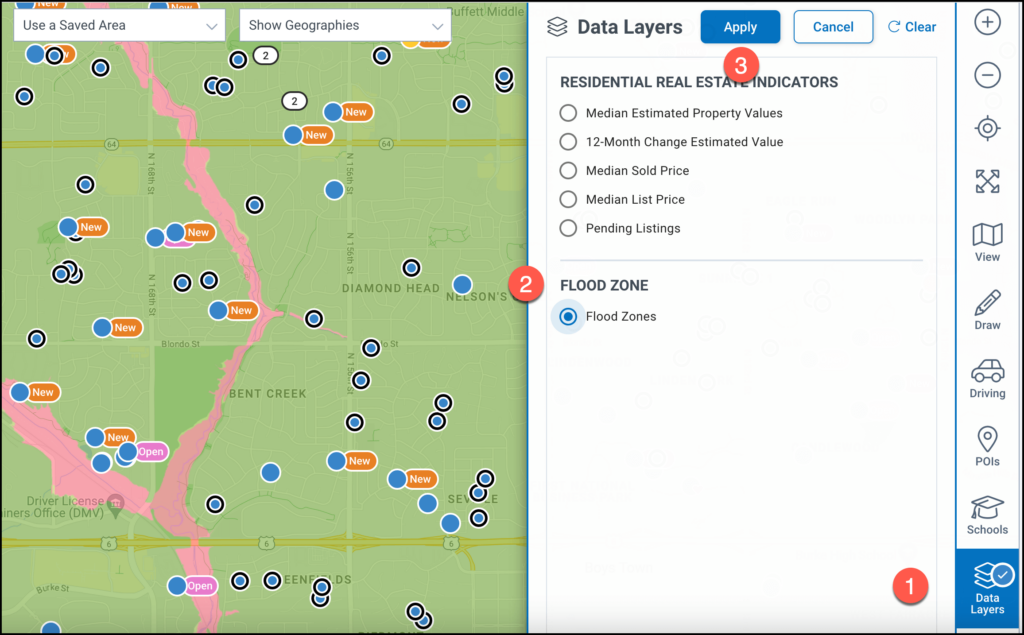
To see an area’s Flood Map Zone data layer, select the map view in your search results and follow the steps below.
- 1
Select the Data Layer icon in the right panel of the map.
- 2
Choose Flood Zones at the bottom of the menu.
- 3
Click the Apply button to see the Flood Zone map layer.

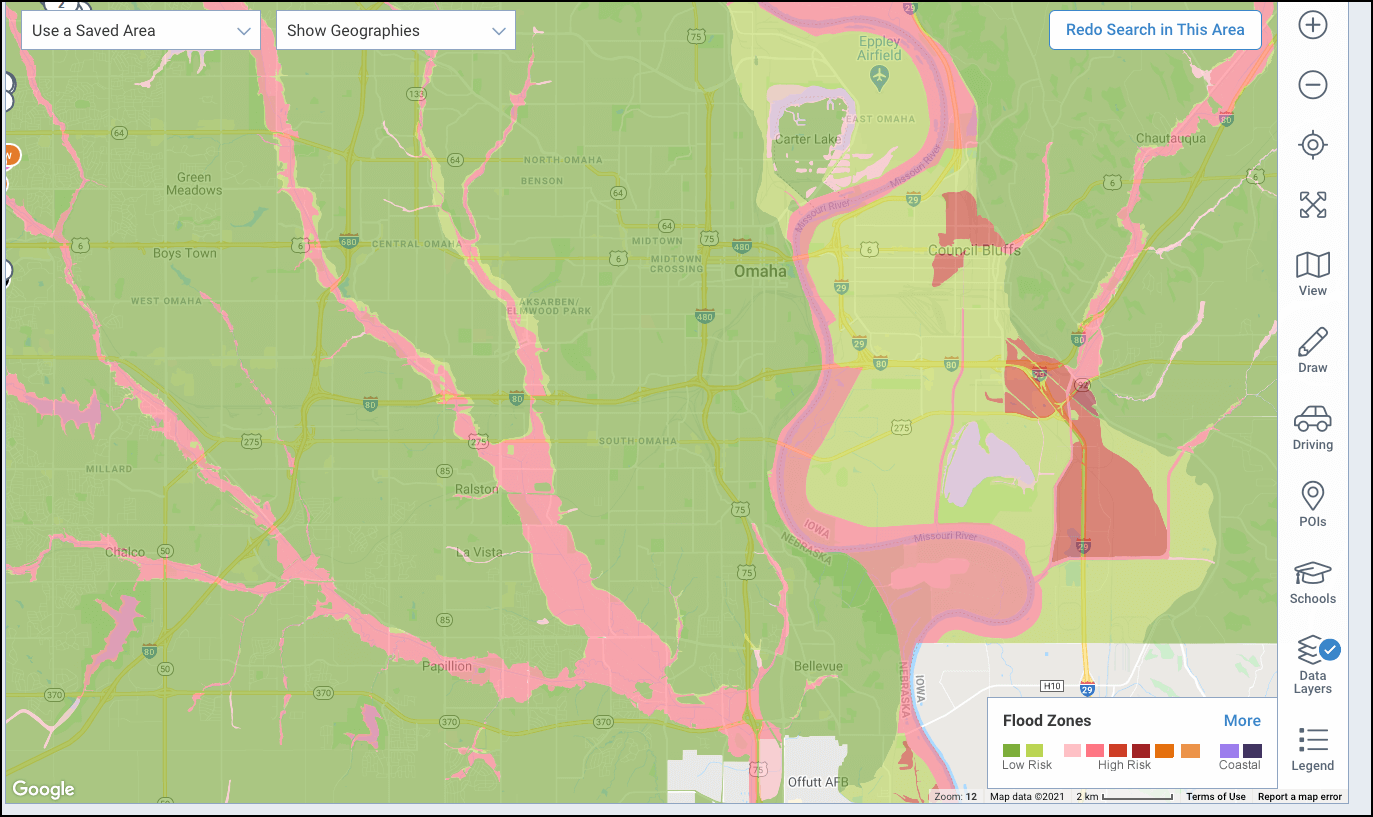
The map layer is applied, and the key is located at the bottom right of the map.

High Risk
A high-risk area has a 1 percent or greater annual chance of flooding and a 26 percent chance of flooding over the life of a 30-year mortgage.
High-risk areas are shaded red or orange on the map. The coast areas, shown in purple, are also considered high risk.
Low/Moderate Risk
The green areas are low to moderate risk. A moderate-risk area is between risk limits of a 100-year and 500-year flood. White areas are undetermined, and all other areas are considered no or low risk.
More Info from FEMA
Click on the links below for additional details from FEMA regarding data quality
The National Flood Hazard Layer (NFHL) data incorporates all Digital Flood Insurance Rate Map (DFIRM) databases published by FEMA, and any Letters Of Map Revision (LOMRs) that have been issued against those databases since their publication date. The DFIRM database consists of community-based vector files and associated attributes produced in conjunction with the hard copy FEMA FIRM. The published effective FIRM and DFIRM maps are issued as the official designation of the Special Flood Hazard Areas (SFHAs). As such they are adopted by local communities and form the basis for administration of the National Flood Insurance Program (NFIP). For these purposes they are authoritative. Provisions exist in the regulations for public review, appeals and corrections of the flood risk information shown to better match real world conditions. As with any engineering analysis of this type, variation from the estimated flood heights and floodplain boundaries is possible. Details of FEMA’s requirements for the FISs and flood mapping process that produces these data are available in the Guidelines and Specifications for Flood Hazard Mapping Partners.
Attribute accuracy was tested by manual comparison of source graphics with hardcopy plots and a symbolized display on an interactive computer graphic system. Independent quality control testing of FEMA’s DFIRM databases was also performed. To obtain more detailed information in areas where Base Flood Elevations (BFEs) and/or floodways have been determined, users are encouraged to consult the Flood Profiles and Floodway Data and/or Summary of Stillwater Elevations tables contained within the FIS report that accompanies the individual components of the DFIRM data. Users should be aware that BFEs shown in the S_BFE table represent rounded whole-foot elevations. These BFEs are intended for flood insurance rating purposes only and should not be used as the sole source of flood elevation information. Accordingly, flood elevation data presented in the FIS report must be used in conjunction with the FIRM for purposes of construction and/or floodplain management. The 1-percent-annual-chance water-surface elevations shown in the S_XS table match the regulatory elevations shown in the FIS report.
When FEMA revises an FIS, adjacent studies are checked to ensure agreement between flood elevations at the boundaries. Likewise flood elevations at the confluence of streams studied independently are checked to ensure agreement at the confluence. The FIRM and the FIS are developed together and care is taken to ensure that the elevations and other features shown on the flood profiles in the FIS agree with the information shown on the FIRM. However, the elevations as shown on the FIRM are rounded whole-foot elevations. They must be shown so that a profile recreated from the elevations on the FIRM will match the FIS profiles within one half of one foot.
Completeness: Information contained in the National Flood Hazard Layer data reflects the content of the source materials. Features may have been eliminated or generalized on the source graphic, due to scale and legibility constraints. With new mapping, FEMA plans to maintain full detail in the spatial data it produces. However, older information is often transferred from existing maps where some generalization has taken place. Flood risk data are developed for communities participating in the NFIP for use in insurance rating and for floodplain management. Flood hazard areas are determined using statistical analyses of records of river flow, storm tides, and rainfall; information obtained through consultation with the communities; floodplain topographic surveys; and hydrological and hydraulic analysis. Both detailed and approximate analyses are employed. Generally, detailed analyses are used to generate flood risk data only for developed or developing areas of communities. For areas where little or no development is expected to occur, FEMA uses approximate analyses to generate flood risk data. Typically, only drainage areas that are greater than one square mile are studied. The National Flood Hazard Layer data reflects the most current information available when the distribution data set was created.
The National Flood Hazard Layer data consists of community based vector files and associated attributes produced in conjunction with the hardcopy FEMA FIRM. The published effective FIRM and DFIRM maps are issued as the official designation of the SFHAs. As such they are adopted by local communities and form the basis for administration of the NFIP. For these purposes they are authoritative. Provisions exist in the regulations for public review, appeals and corrections of the flood risk information shown to better match real world conditions. As with any engineering analysis of this type, variation from the estimated flood heights and floodplain boundaries is possible. Details of FEMA’s requirements for the FISs and flood mapping process that produces these data are available in the Guidelines and Specifications for Flood Hazard Mapping Partners. Horizontal accuracy was tested by manual comparison of source graphics with hardcopy plots and a symbolized display on an interactive computer graphic system. Independent quality control testing of the individual DFIRM data sets was also performed.
The National Flood Hazard Layer data consists of community based vector files and associated attributes produced in conjunction with the hardcopy FEMA FIRM. The published effective FIRM and DFIRM maps are issued as the official designation of the SFHAs. As such they are adopted by local communities and form the basis for administration of the NFIP. For these purposes they are authoritative. Provisions exist in the regulations for public review, appeals and corrections of the flood risk information shown to better match real world conditions. As with any engineering analysis of this type, variation from the estimated flood heights and floodplain boundaries is possible. Details of FEMA’s requirements for the FISs and flood mapping process that produces these data are available in the Guidelines and Specifications for Flood Hazard Mapping Partners. Vertical accuracy was tested by manual comparison of source graphics with hardcopy plots and a symbolized display on an interactive computer graphic system. Independent quality control testing of the individual DFIRM data sets was also performed.
RPR updates the FEMA data annually.
RPR’s flood zone maps come from the Federal Emergency Management Agency’s National Flood Hazard Layer (NFHL) data. NFHL data incorporates all Digital Flood Insurance Rate Map (DFIRM) databases published by FEMA, and any Letters Of Map Revision (LOMRs) that have been issued against those databases since their publication date.
The DFIRM database is the digital, geospatial version of the flood hazard information shown on the published Flood Insurance Rate Maps (FIRMs).
The primary risk classifications used are the 1-percent-annual-chance flood event, the 0.2-percent-annual-chance flood event, and areas of minimal flood risk. The NFHL data are derived from Flood Insurance Studies (FISs), previously published Flood Insurance Rate Maps (FIRMs), flood hazard analyses performed in support of the FISs and FIRMs, and new mapping data where available.
RPR’s flood maps do not include data from local municipalities that are not approved by FEMA.
Studies and updates are continually in progress. When a new study is done, there may be a period of time where the old data is considered no longer valid, but the new data is not ready to be official designated. The result is a temporary period where some previously existing areas are missing.
Need Help?
If you need additional assistance, contact RPR Member Support at (877) 977-7576 or open a Live Chat from any page of the website.
Trending
How do I create mailing labels or export owner information?
New
Topics
