
Market Trends
Our popular Market Trend charts offers insight into the residential trends within a neighborhood, ZIP code, county, or city and can be customized and downloaded, copied, included in reports, shared directly on social media or used to create Social Videos, Social Cards, and PowerPoint Presentations, and more!
Access
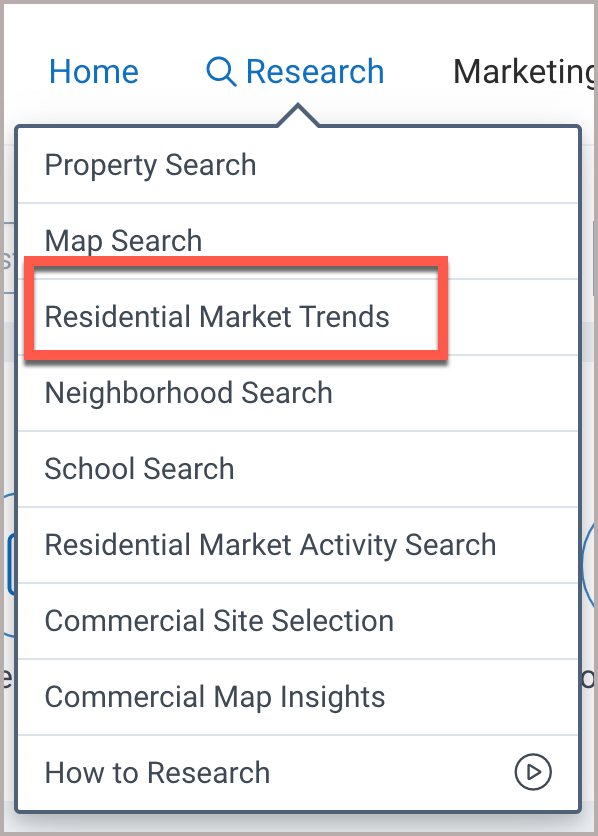
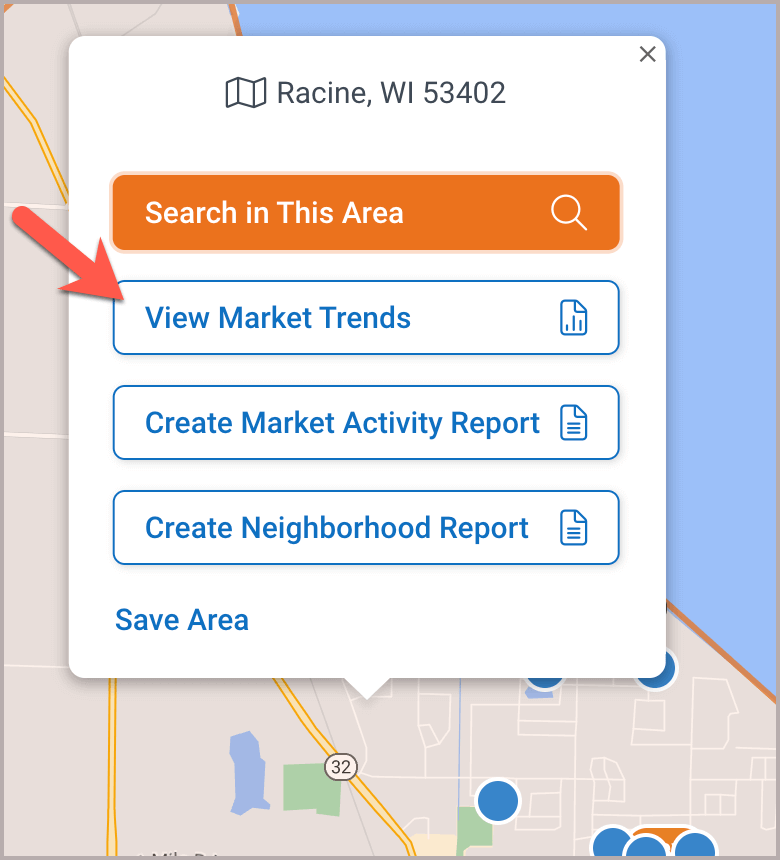
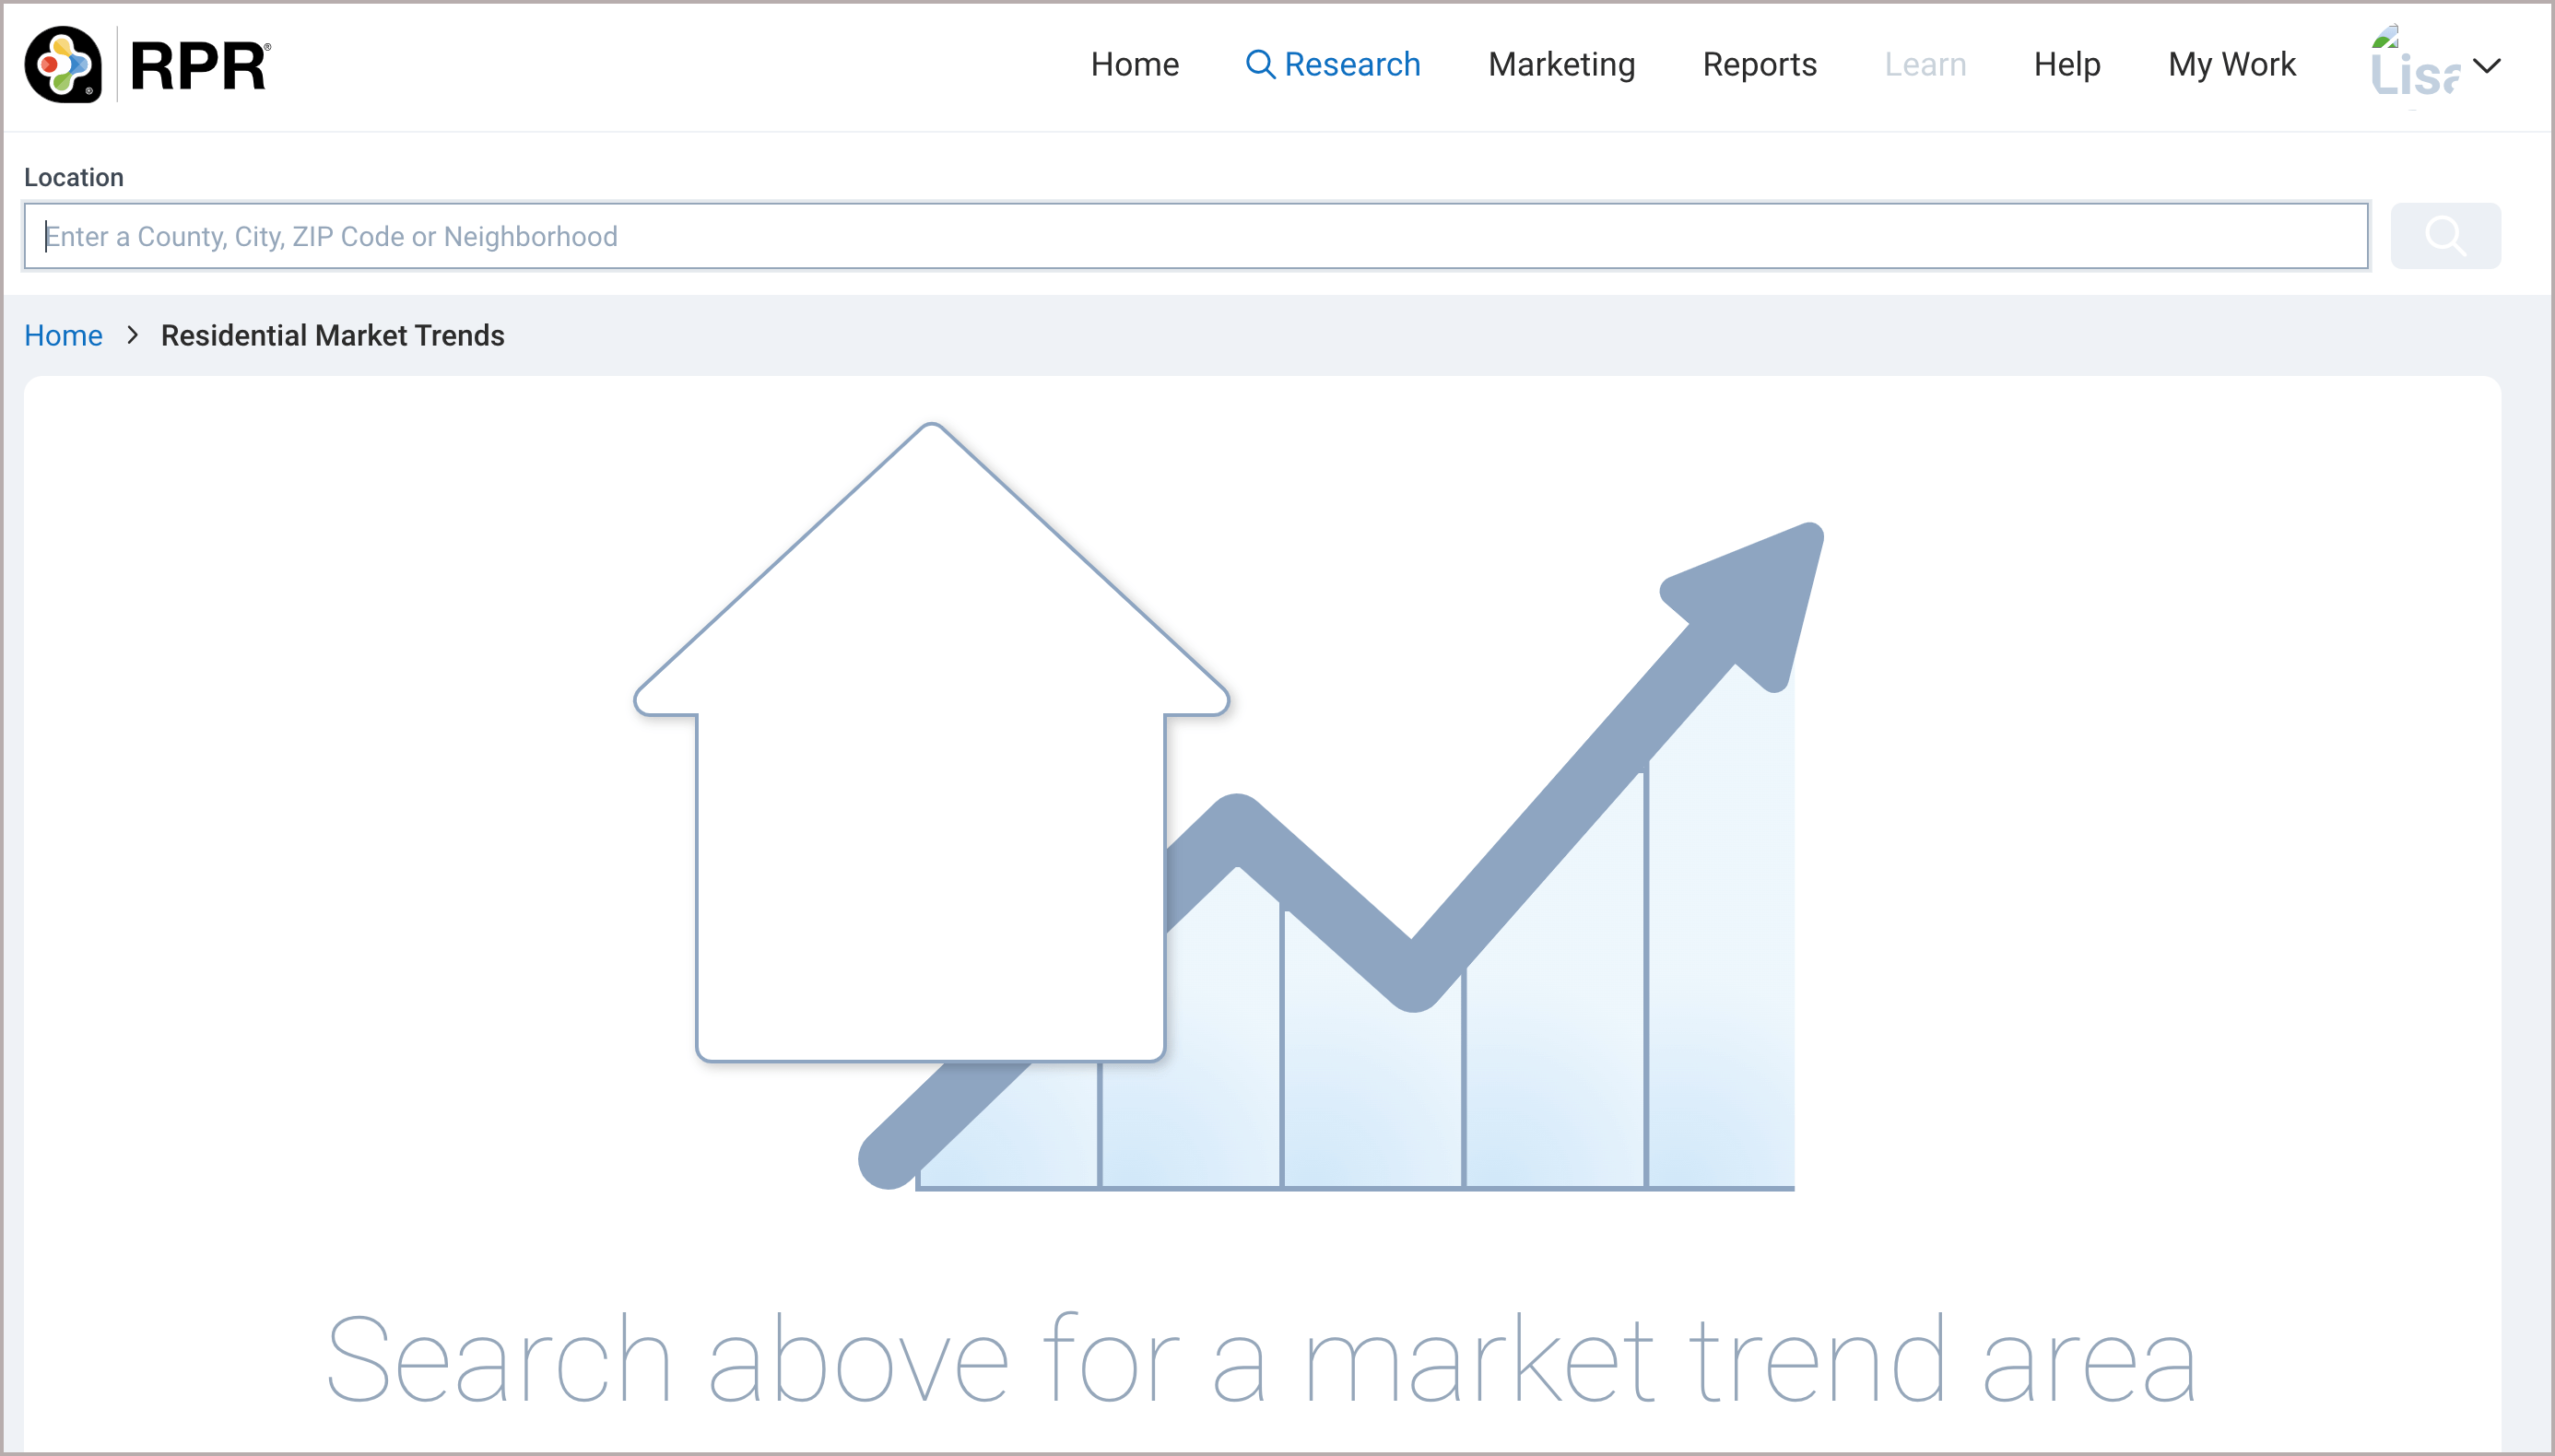
Market Trends has its own search page but can also be found on our Property Details and Neighborhood pages. To access the Market Trends Search Page, click the research tab, then choose Residential Market Trends. Or, choose “View Market Trends” on the map.
Guided Tour
For a Market Trends guided tour, go to the Home page, click the Market Trends Shortcut, and follow the prompts.
Step 1
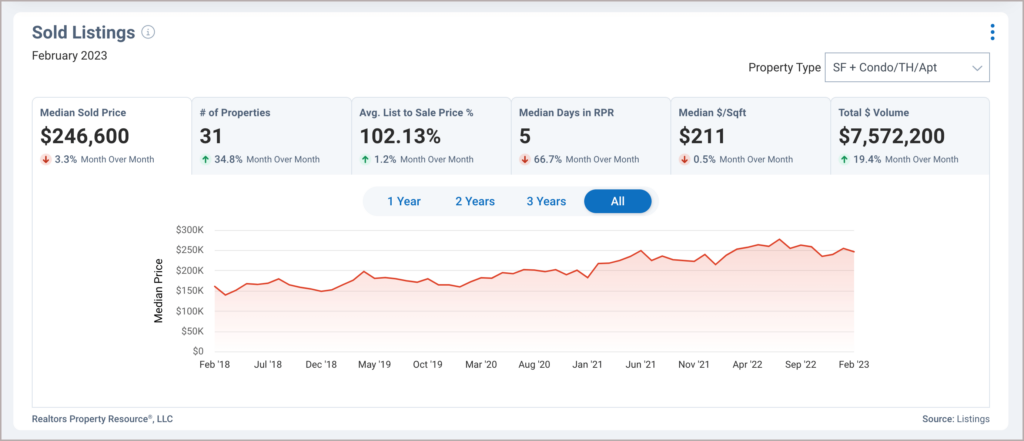
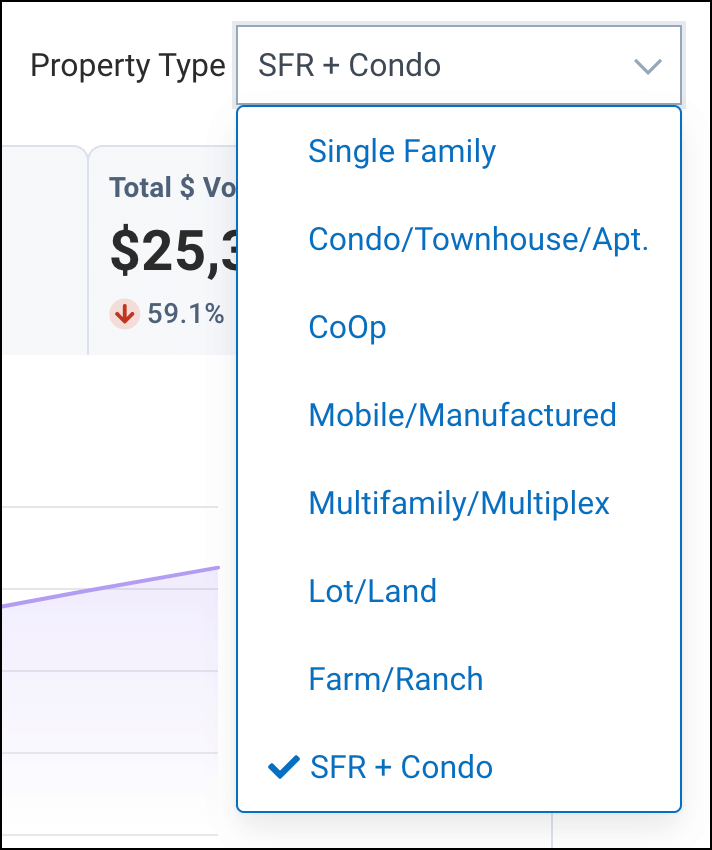
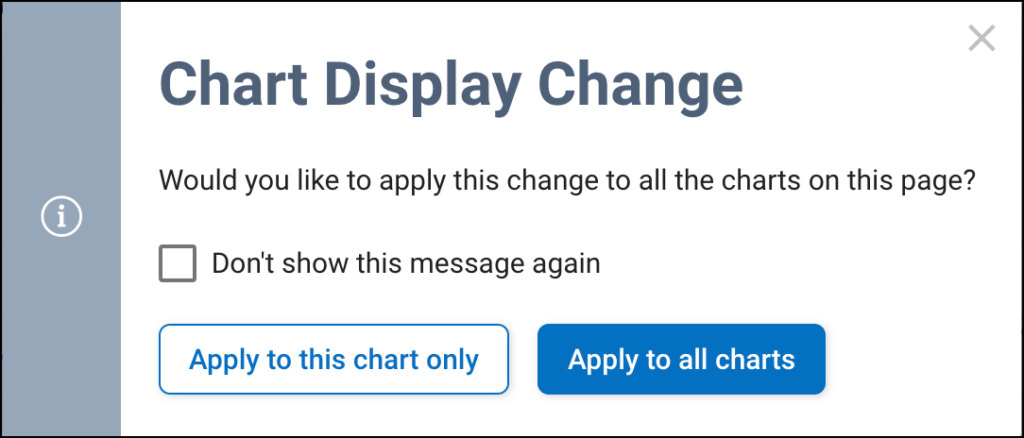
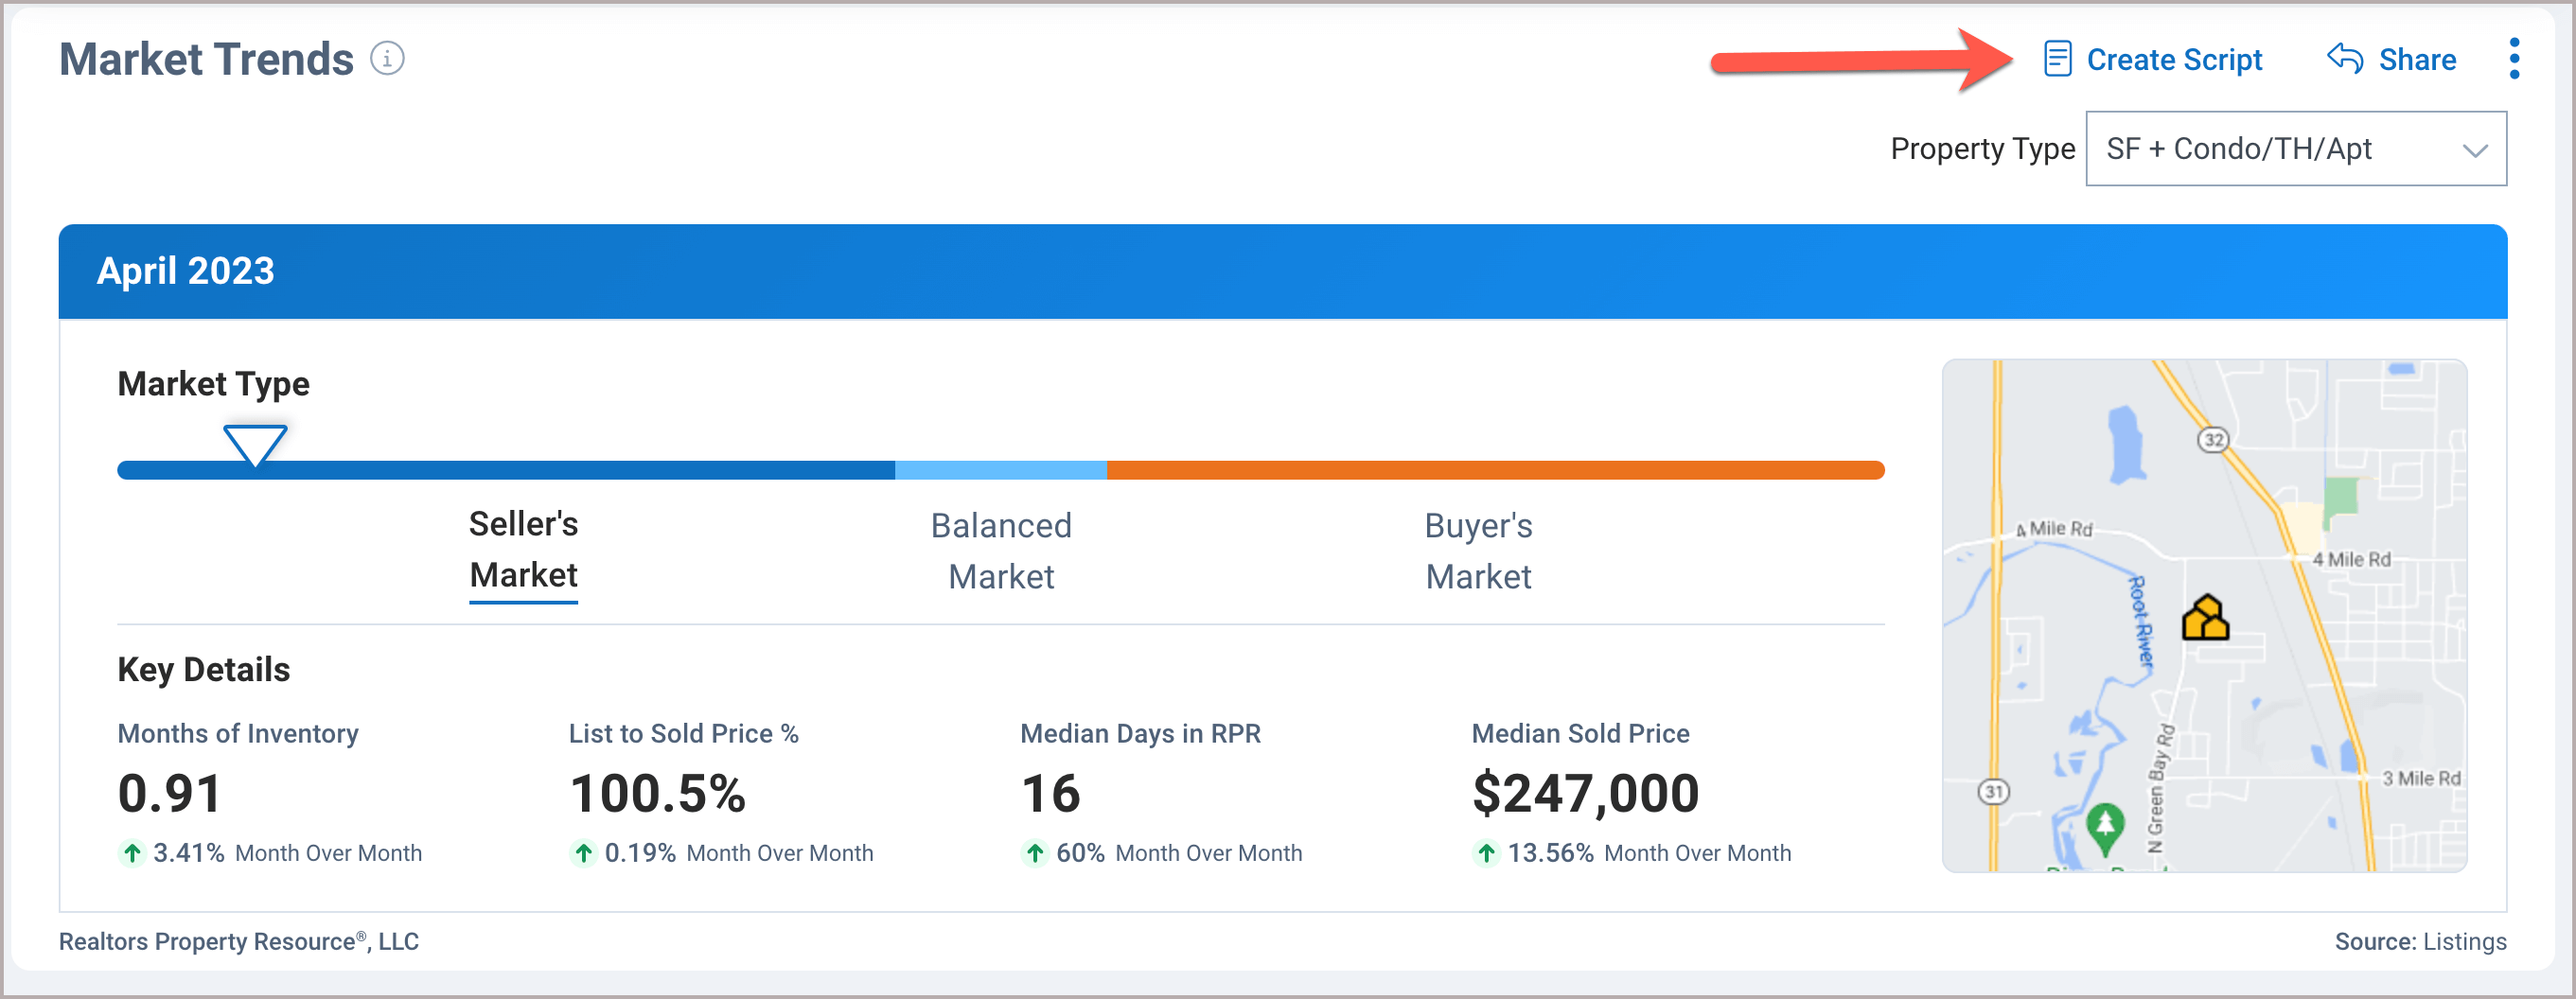
Select a Property Type from the drop-down menu, then apply the Property Type to one chart or to all the charts on the page.
Step 2
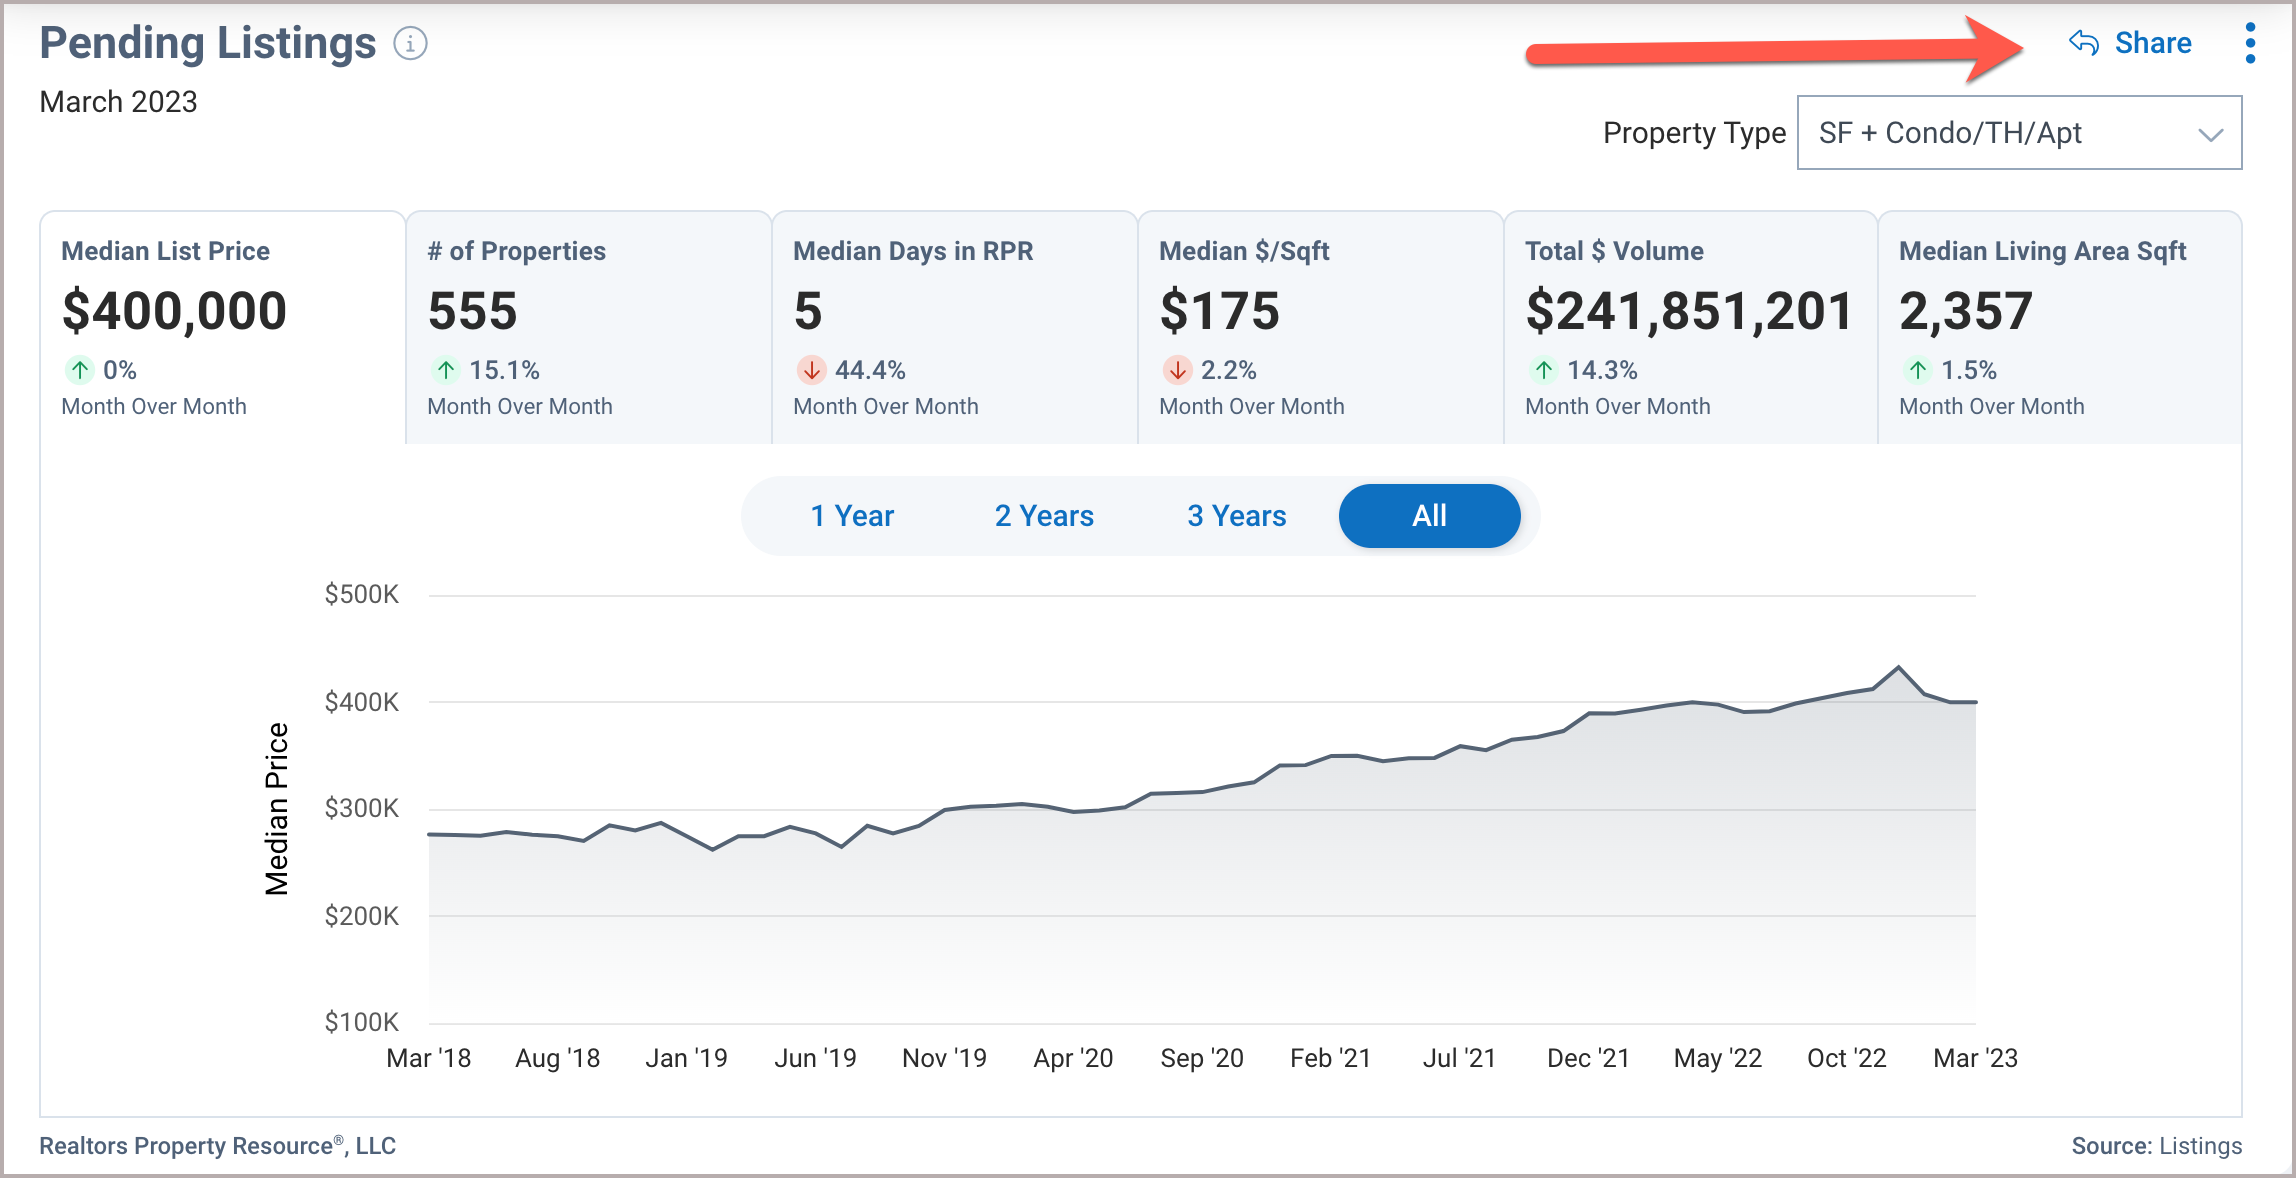
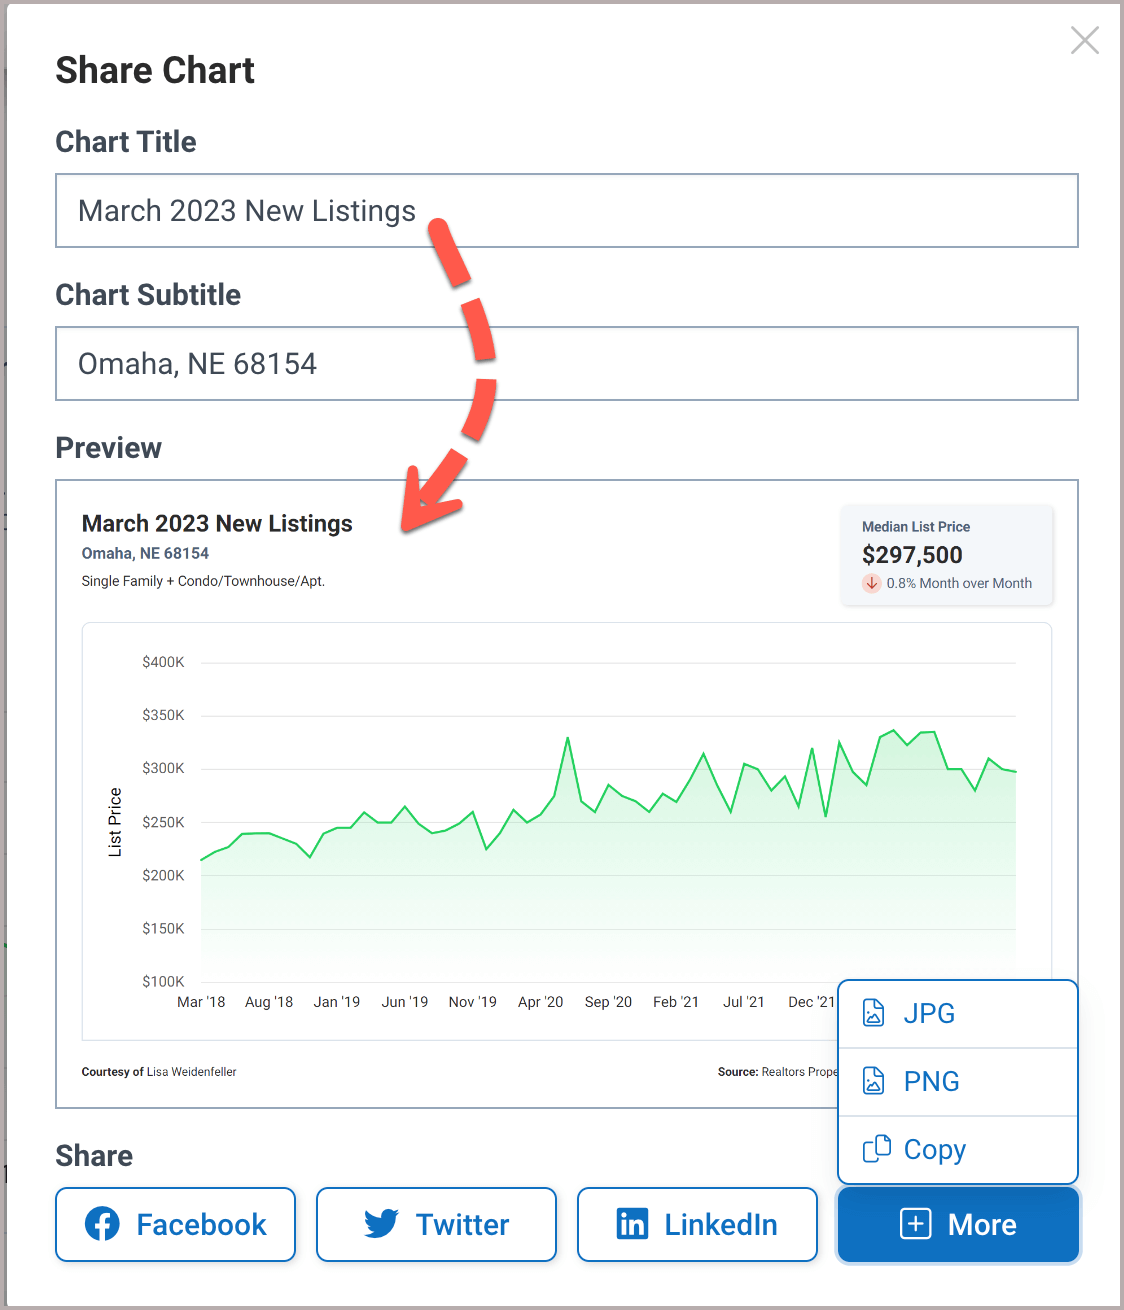
Choose a metric to showcase and select a timeframe, then click the Share link.
Step 3
Enter a custom Title or Subtitle if you would like, choose a social media platform or click More for additional options.
Next Gen Reports - Market Trends Charts
Create PDF
Collapse any charts you do not want to print (and expand charts you do), then click the Print link.
_tiny")
AI Script Writer
Our AI powered ScriptWriter allows you to create branded, ready-to-go Social Videos, Social Media Cards, PowerPoint Presentations, and more based on Market Trend data in just a few minutes!
Click the Create Script link on the Market Trends, then select a Tone and Audience to set a voice and target a specific client type. Next, select your content, follow the prompts, then choose how you would like to share it.

Frequently Asked Questions
Click on the links below
Need Help?
If you need additional assistance, contact RPR Member Support at (877) 977-7576 or open a Live Chat from any page of the website.
