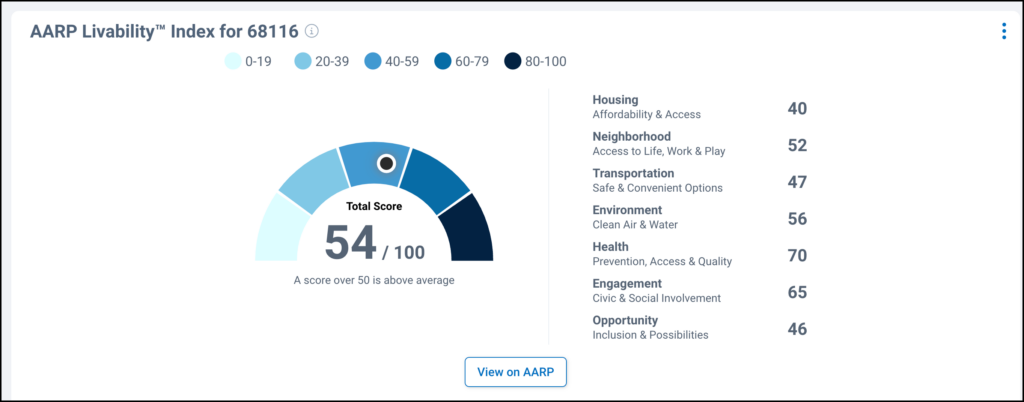
Market Trends and Neighborhood Charts
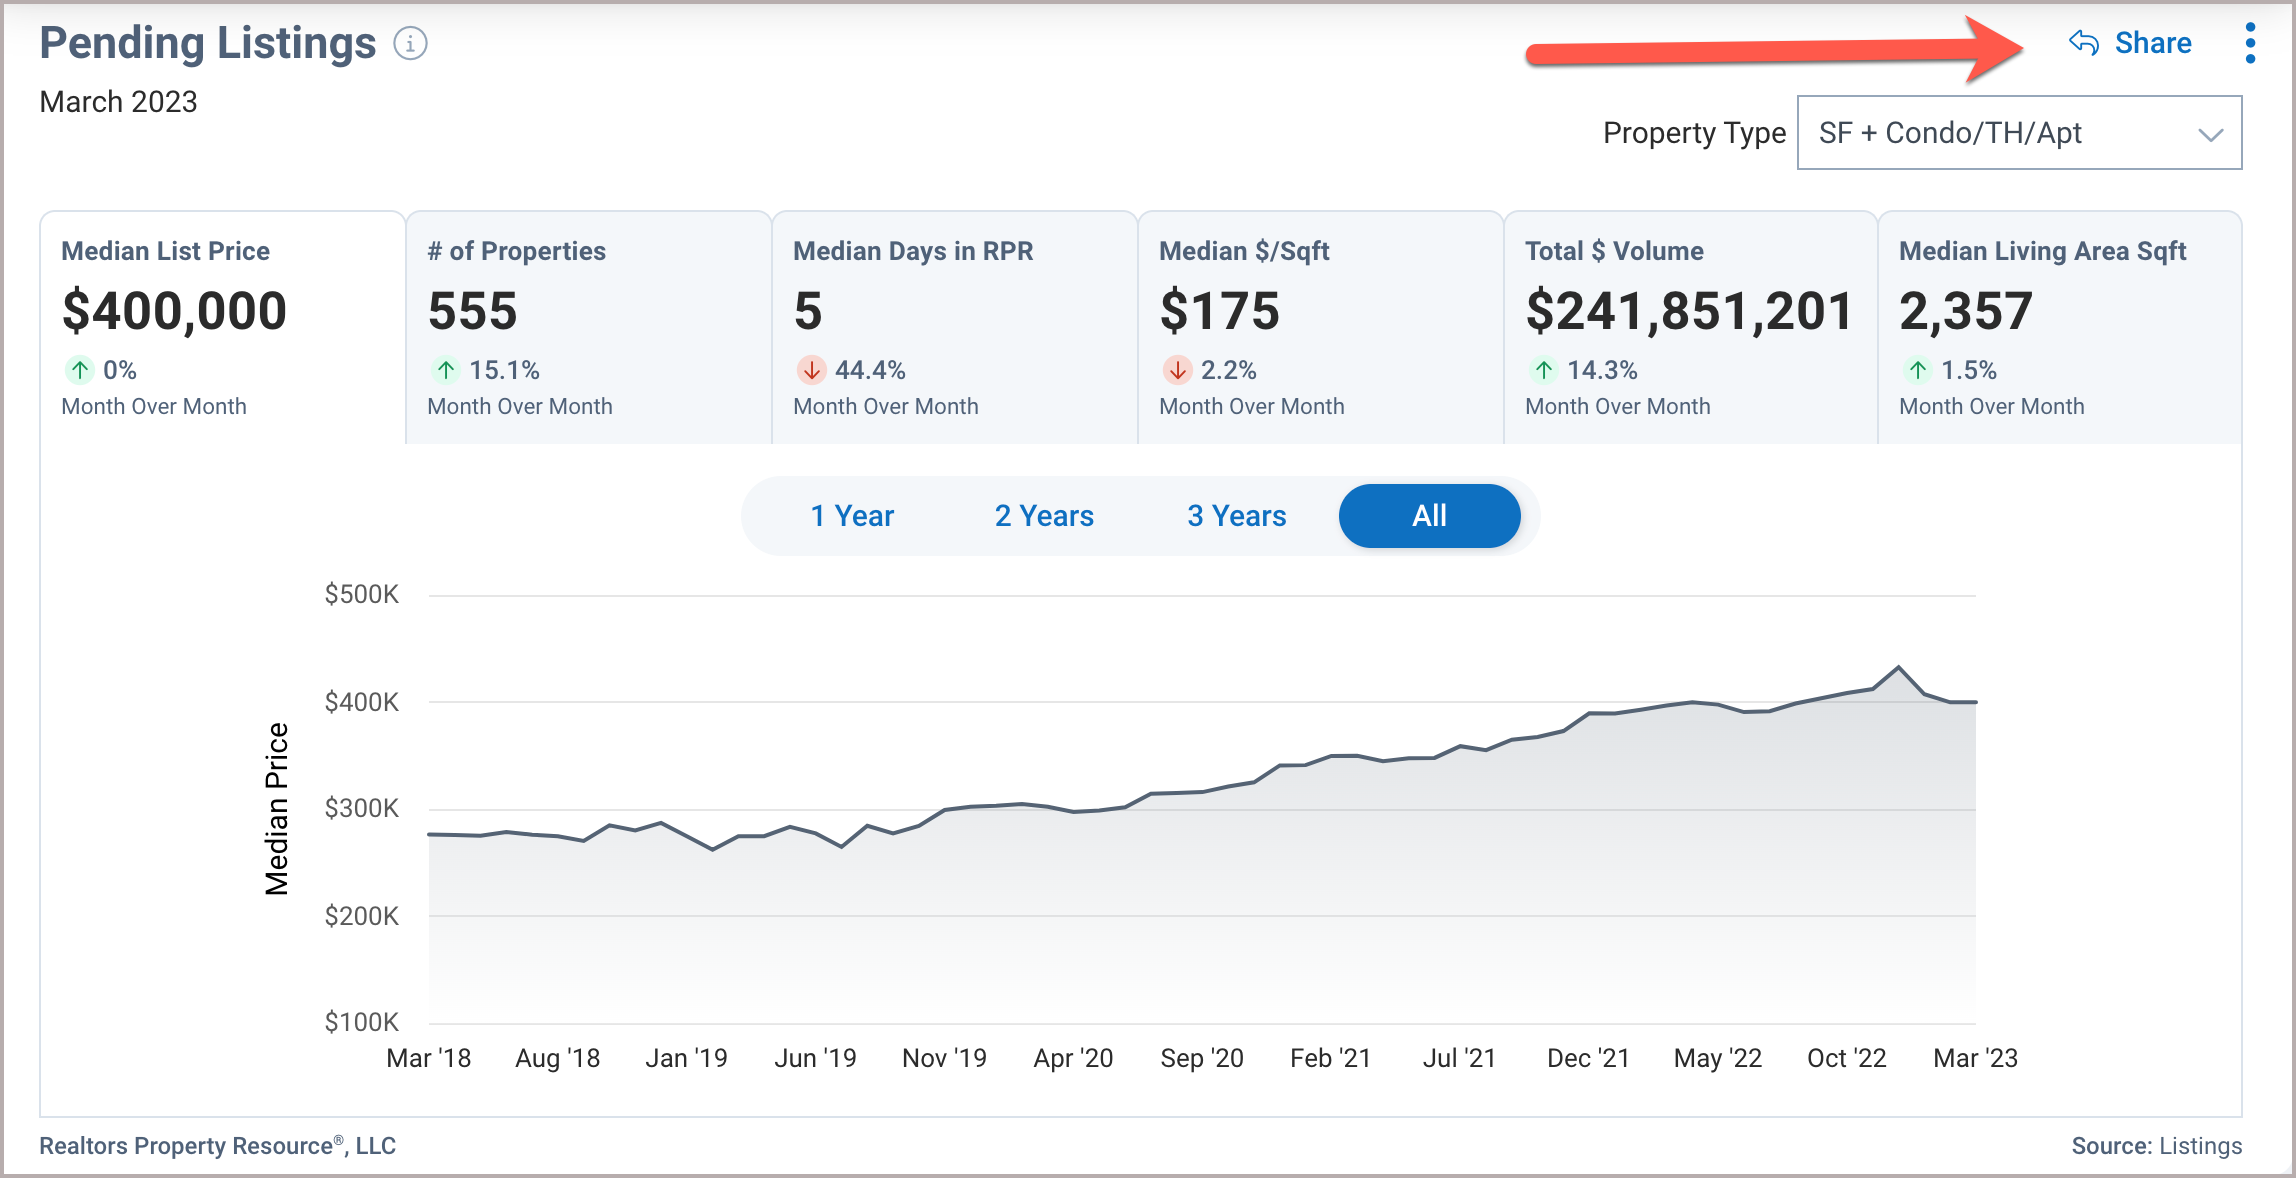
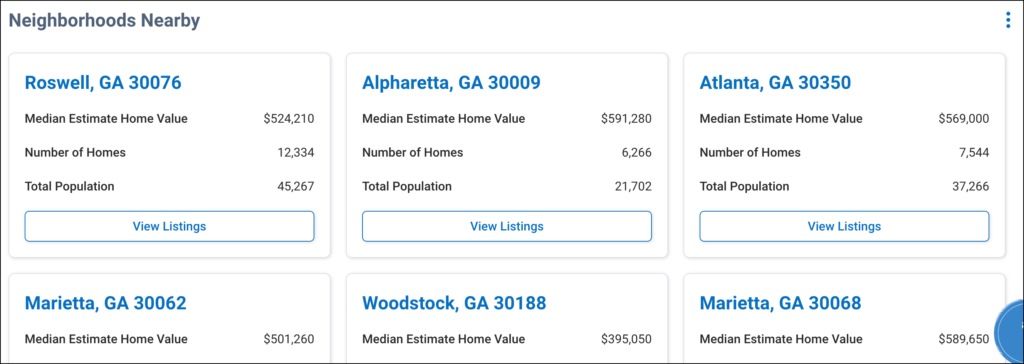
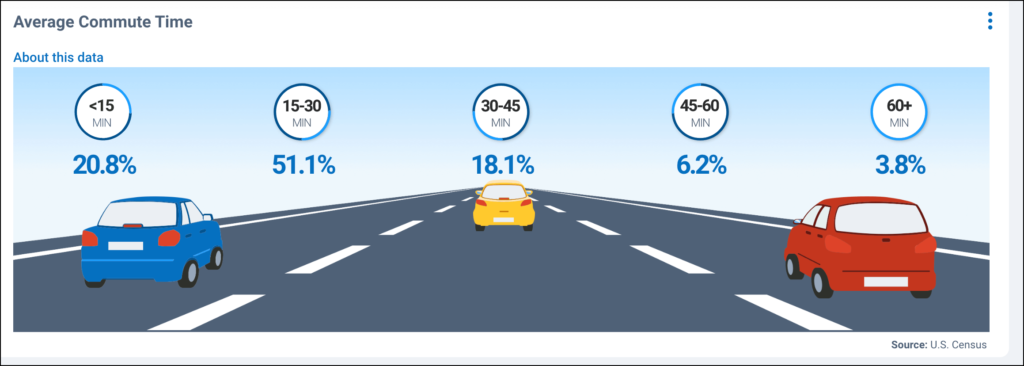
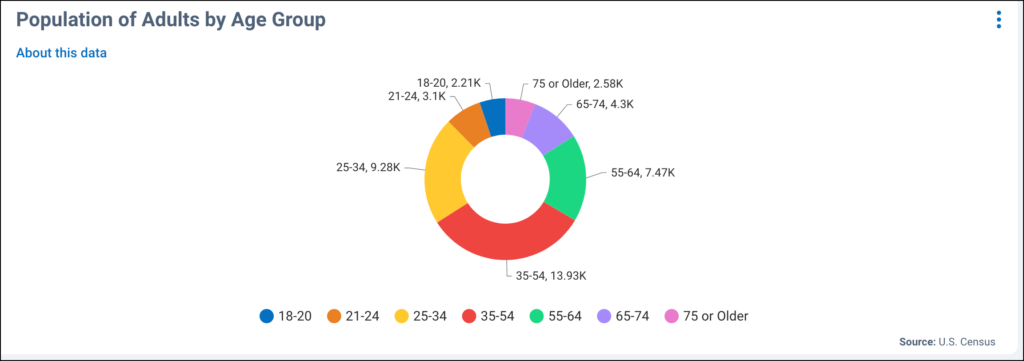
RPR charts offers information about the housing, people, economy, and quality of life of an area. Our popular Market Trend charts offers insight into the residential trends within a neighborhood, ZIP code, county, or city and can be customized and downloaded, copied, or shared directly on Facebook, Twitter, Instagram, and LinkedIn.
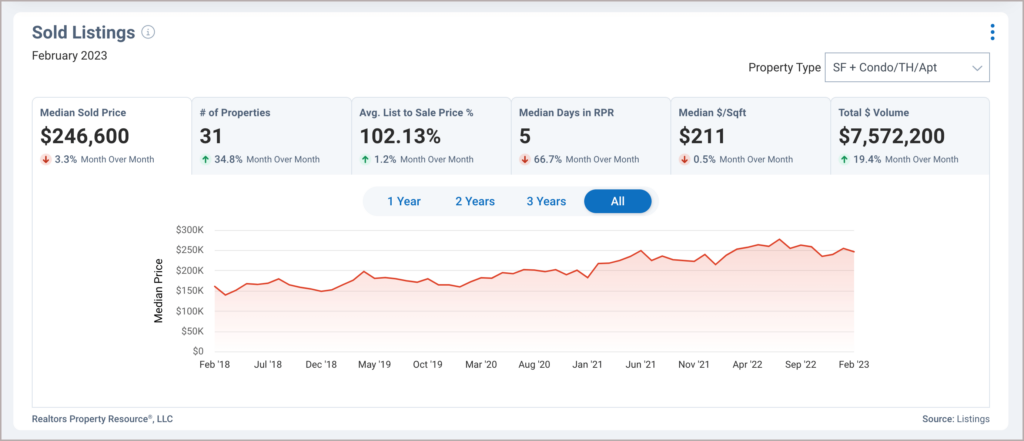
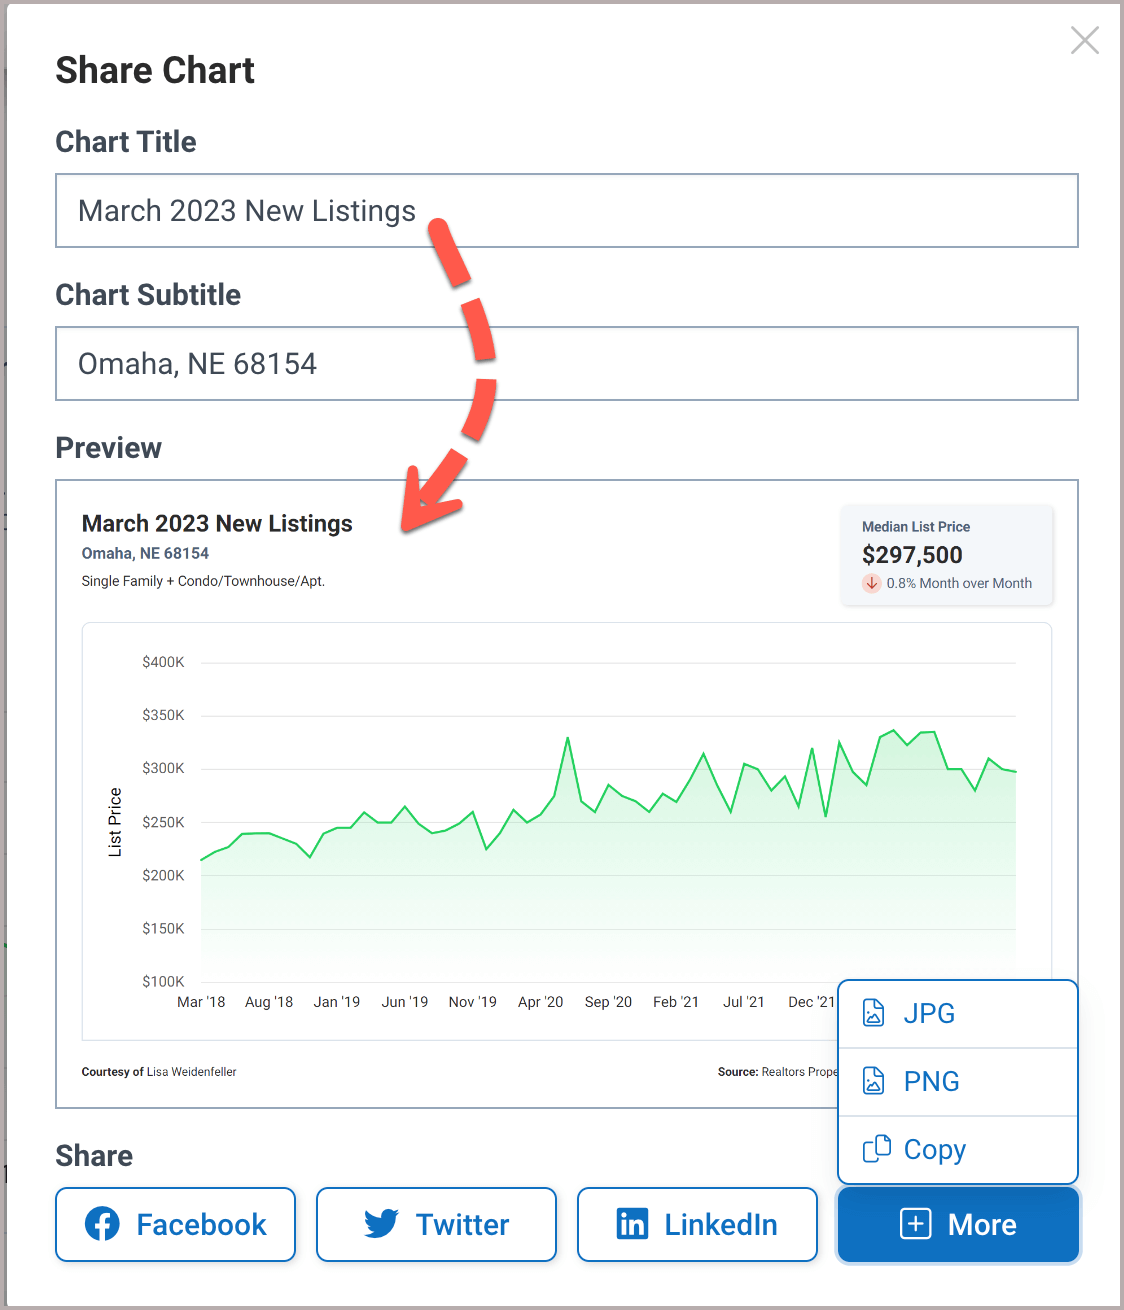
Market Trends – Search Page
Market Trends has its own search page but can also be found on our Property Details and Neighborhood pages.
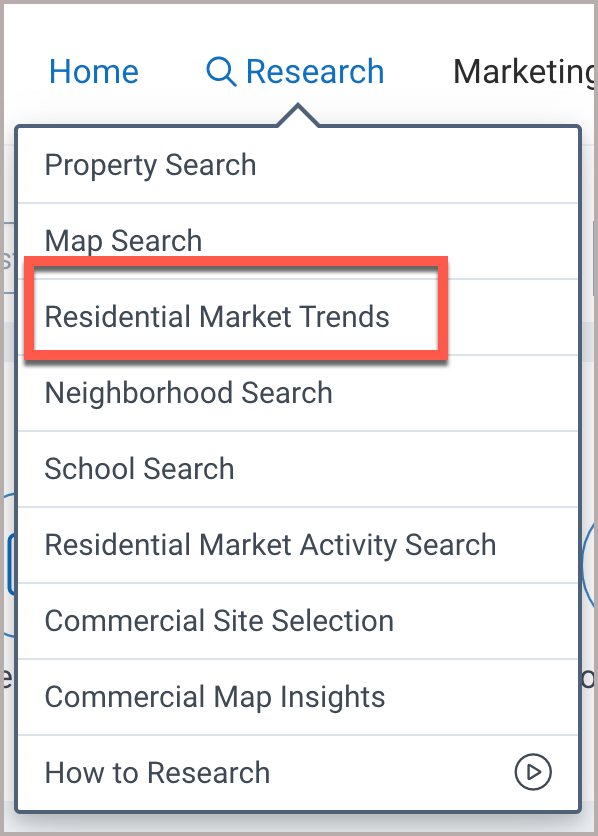
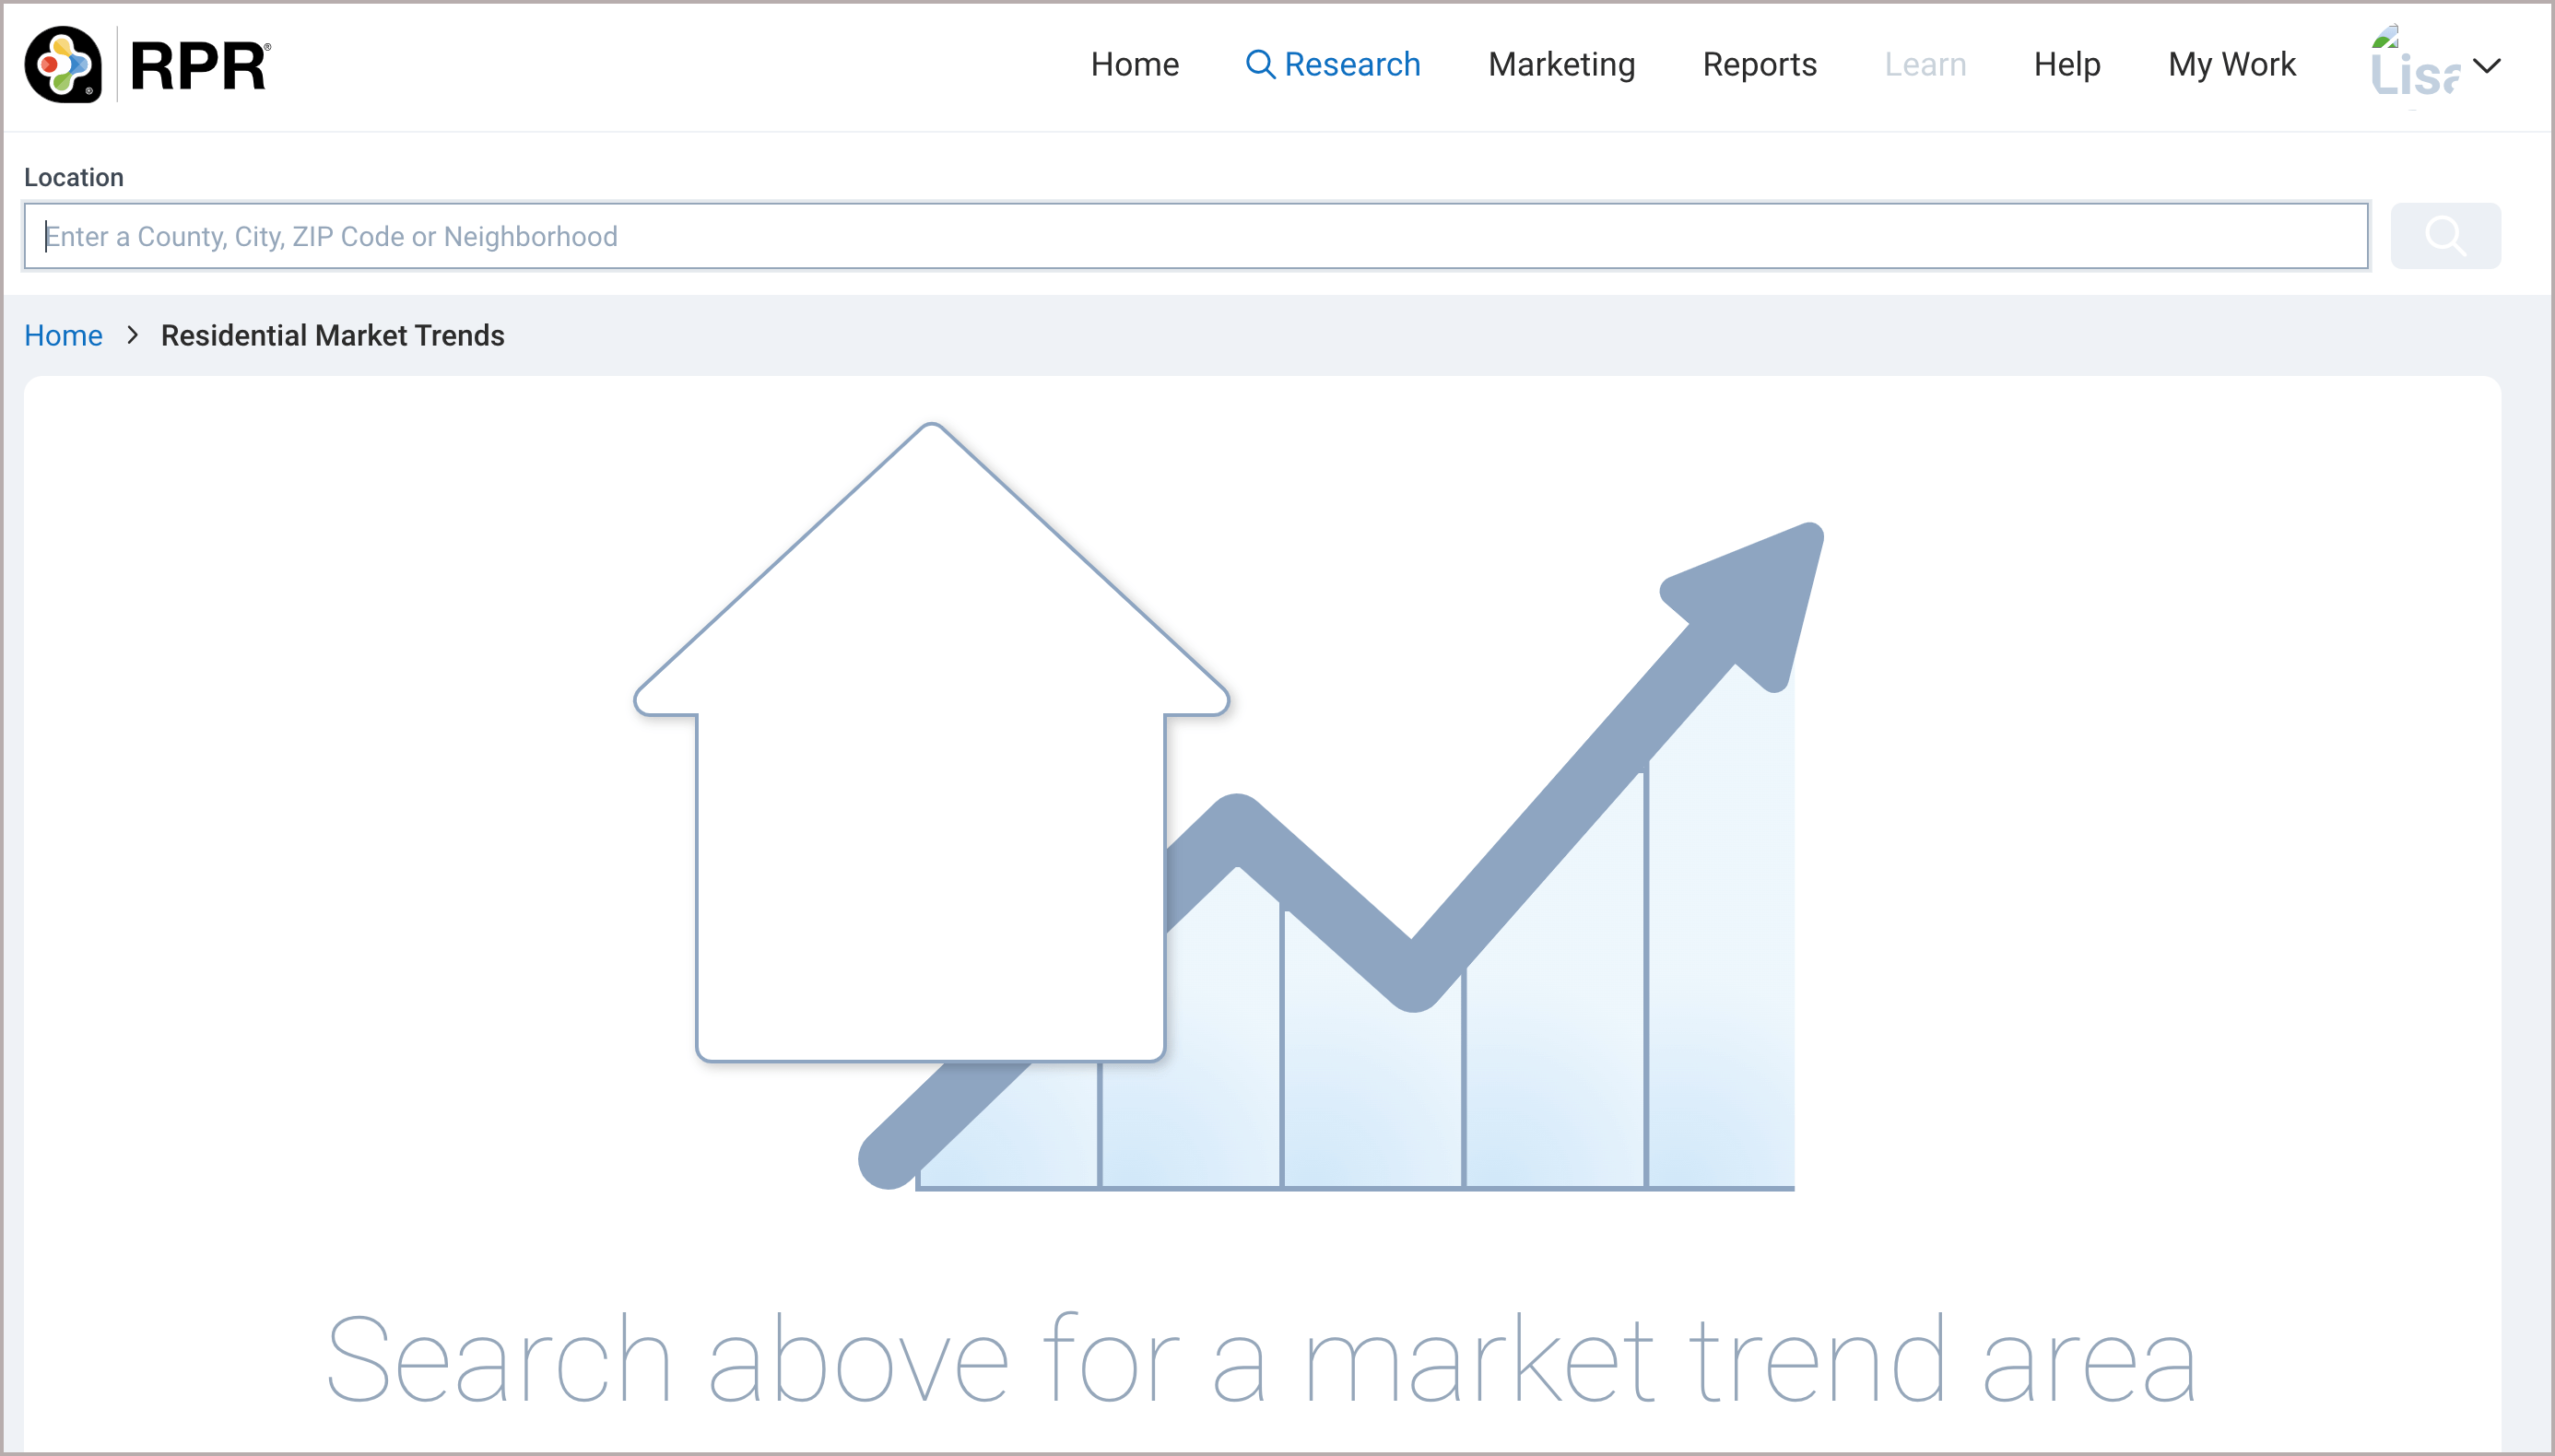
To access the Market Trends Search Page, click the research tab, then choose Residential Market Trends.
Market Trends – Map Access
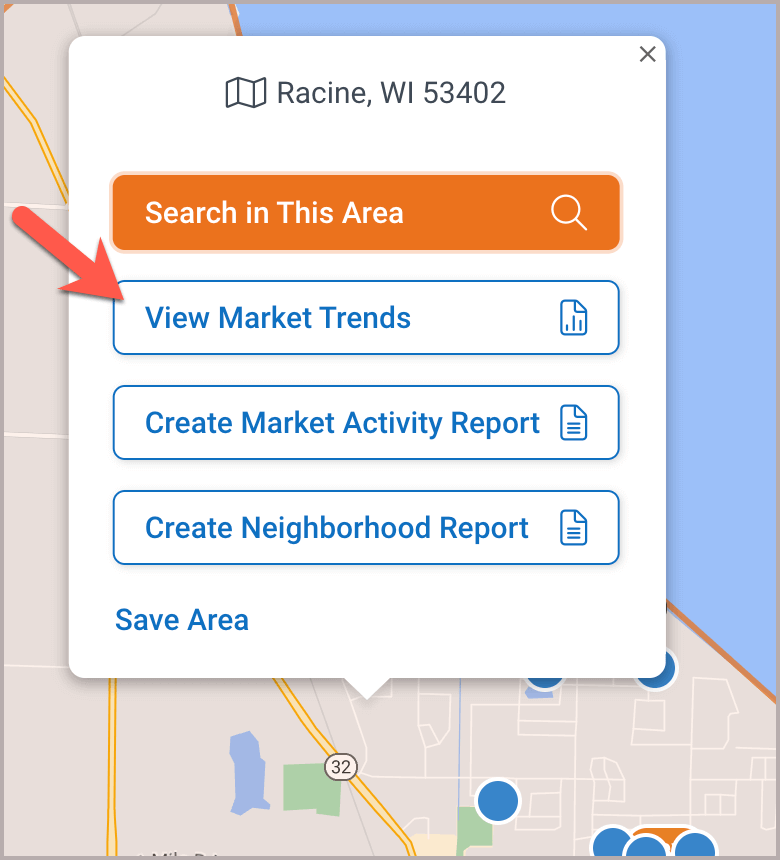
An option to “View Market Trends” is now offered on all residential website maps.
Selecting the View Market Trends button will take you to the new Market Trends Search Page.

Guided Tour
For a Market Trends guided tour, go to the Home page, click the Market Trends Shortcut, and follow the prompts.
Select Property Type
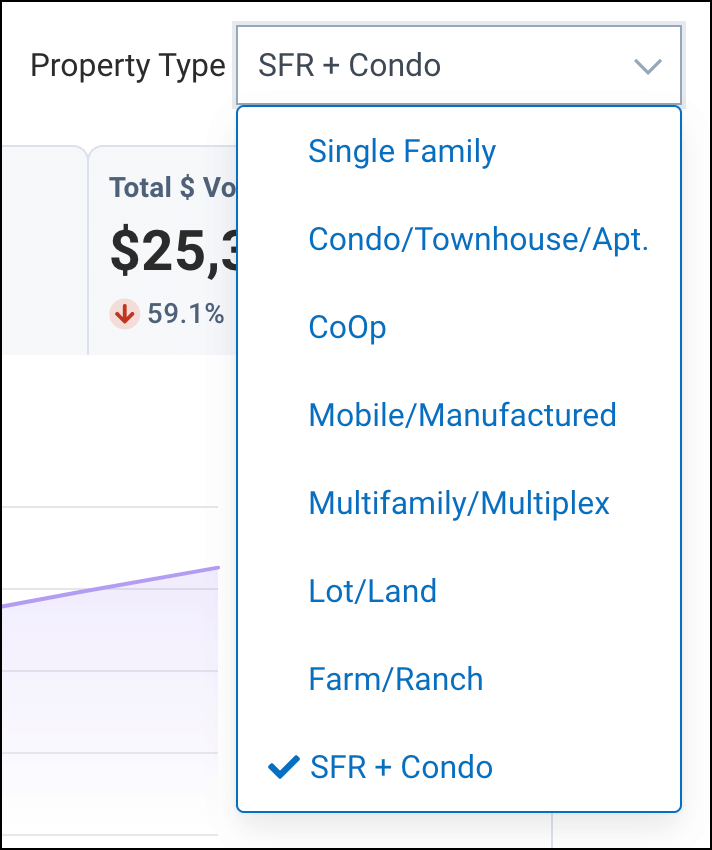
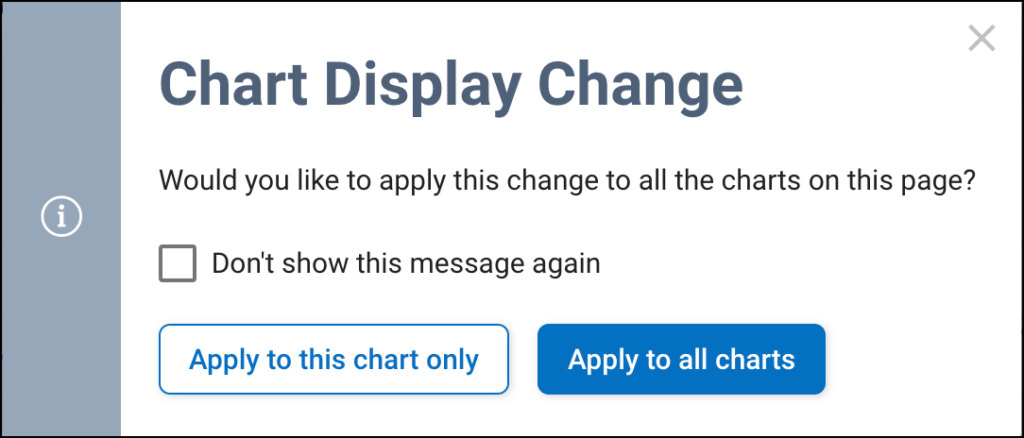
Select a Property Type from the drop-down menu, then apply the Property Type to one chart or to all the charts on the page.
Create PDF
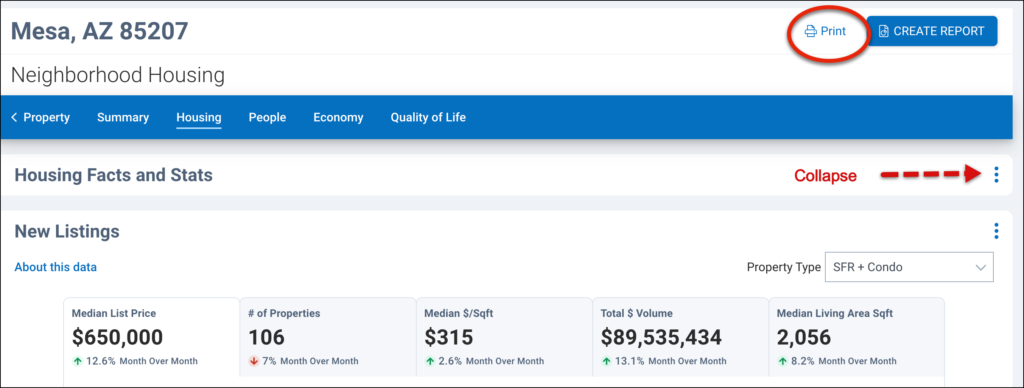
Collapse any charts you do not want to print (and expand charts you do), then click the Print link.
Add PDF to RPR Reports
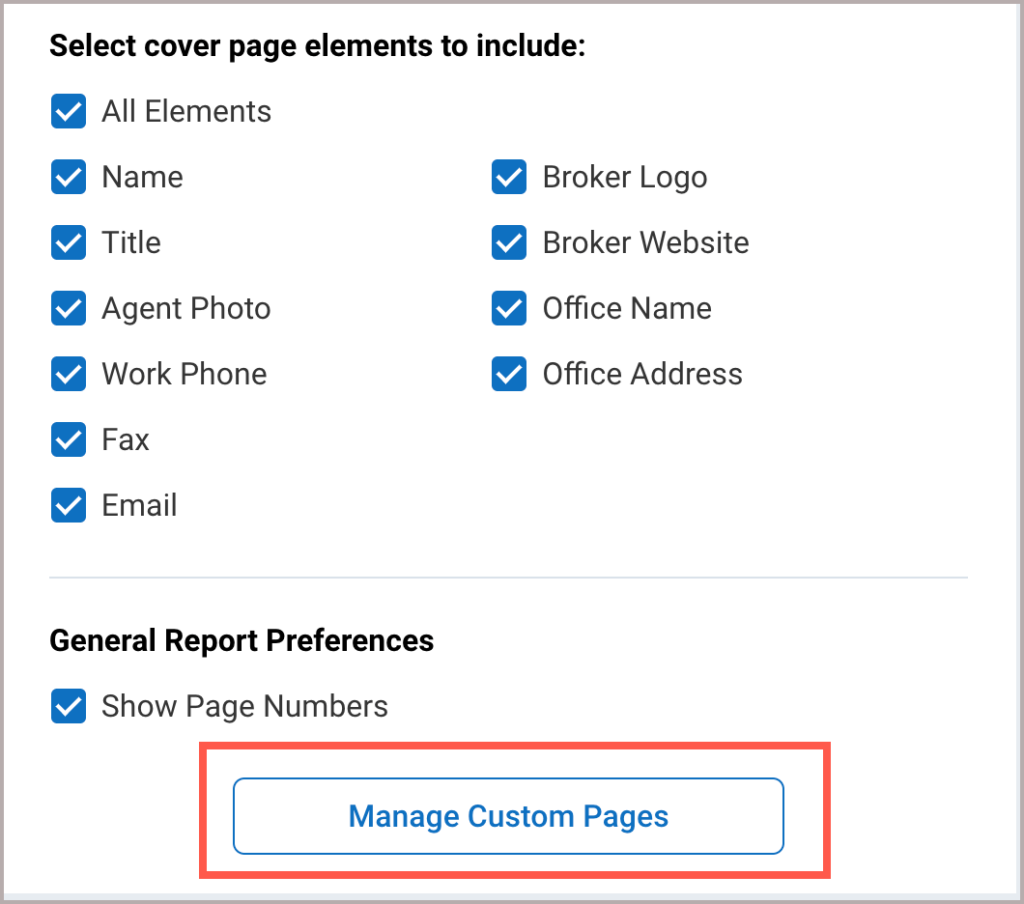
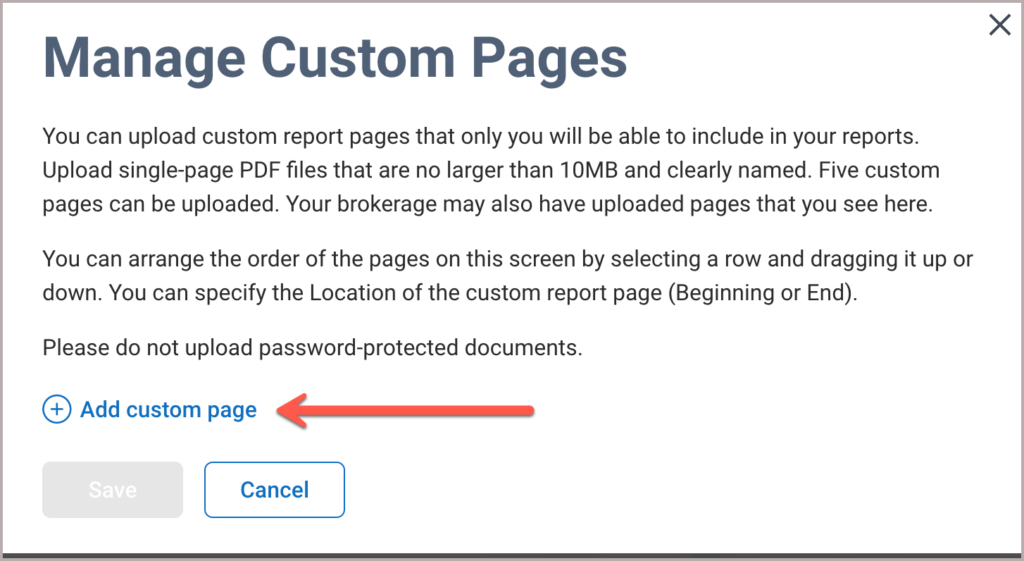
Add your PDF to your RPR reports. Click Manage Custom Pages in the right panel of the Report generation page, then select
AI Script Writer – Market Trends Indicator Chart
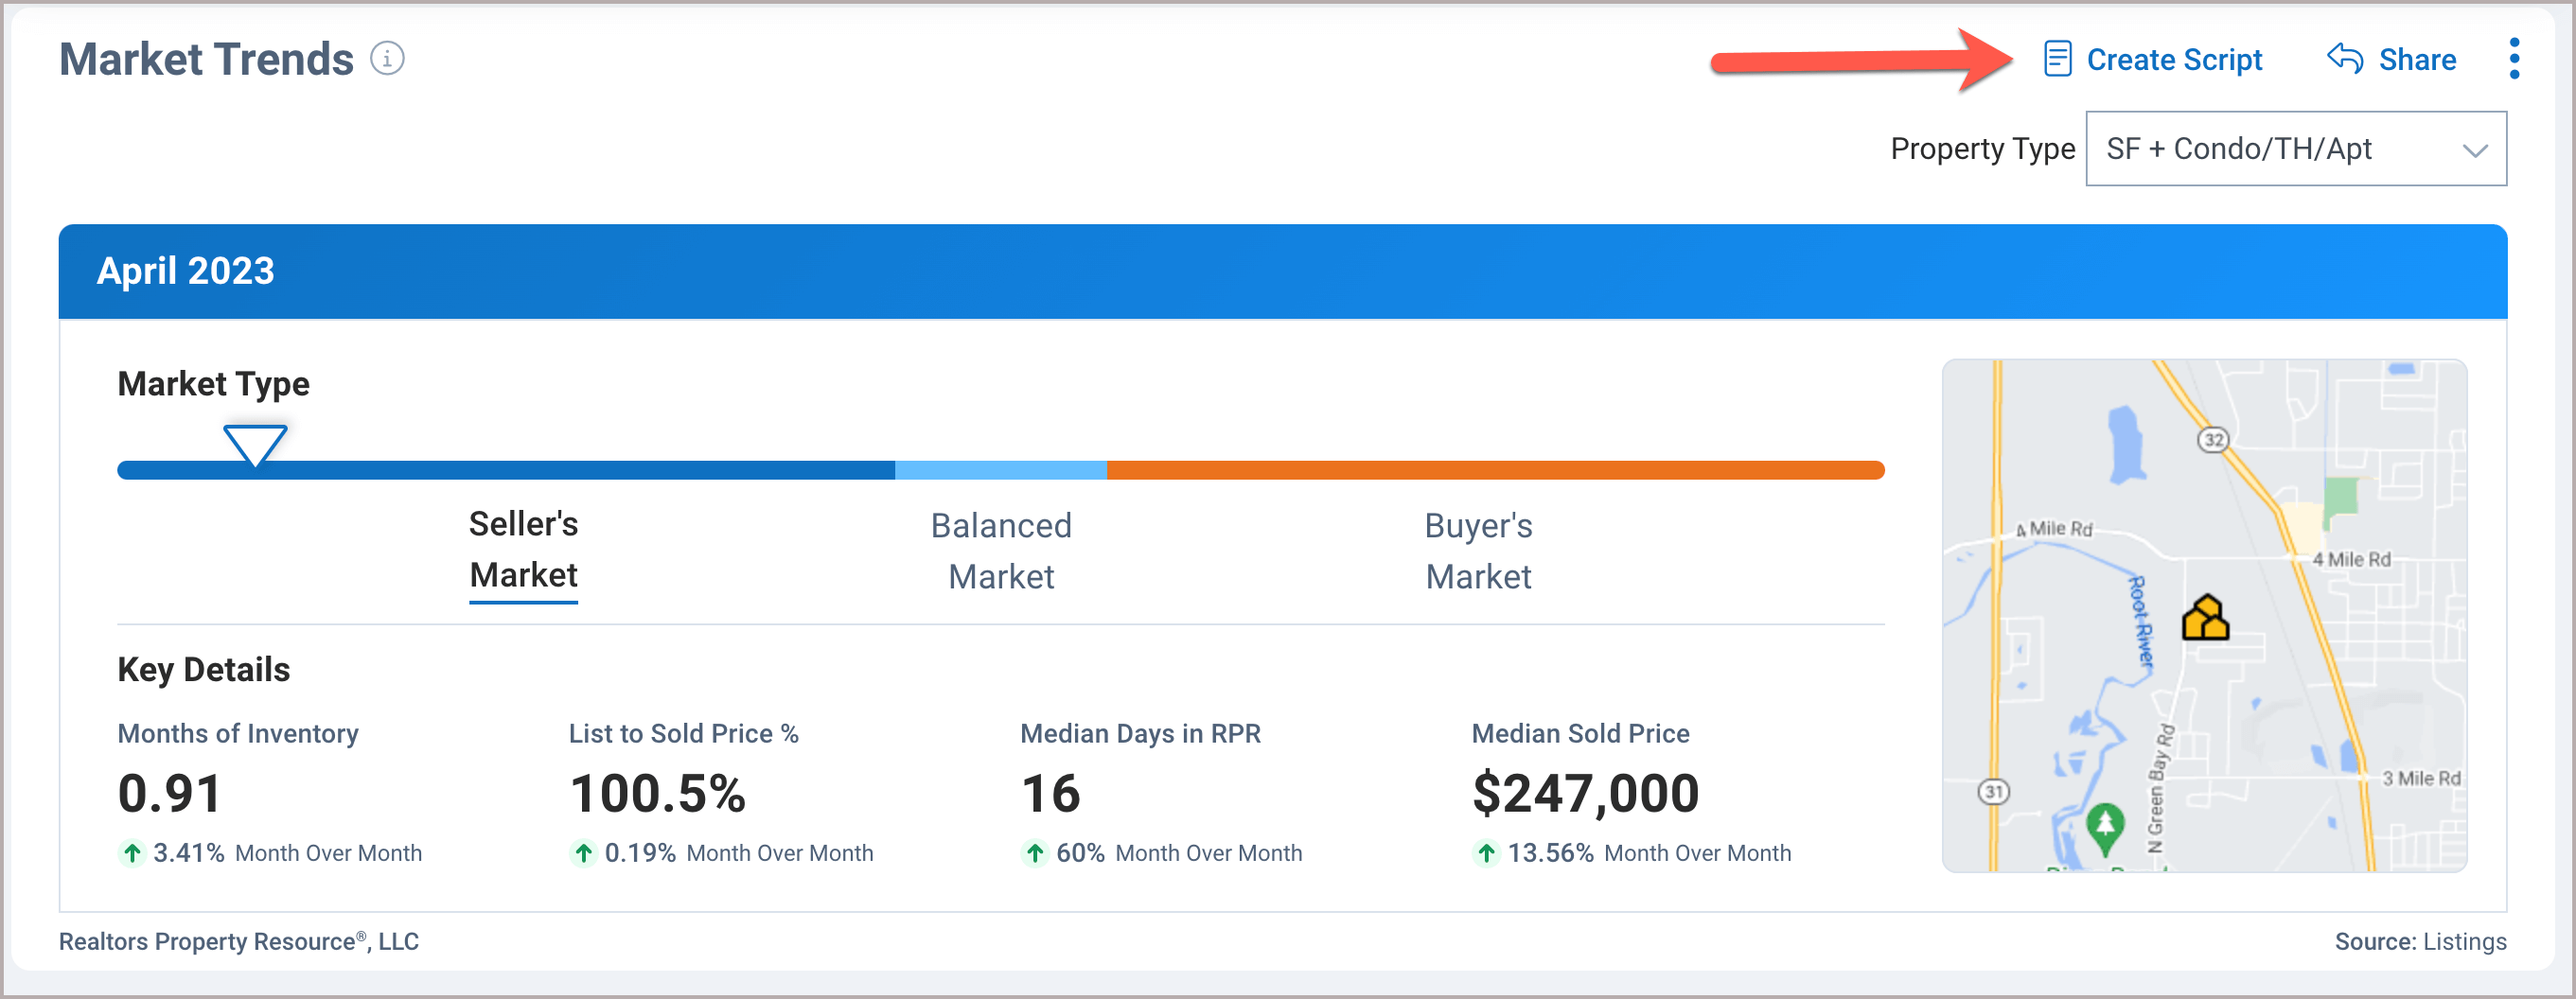
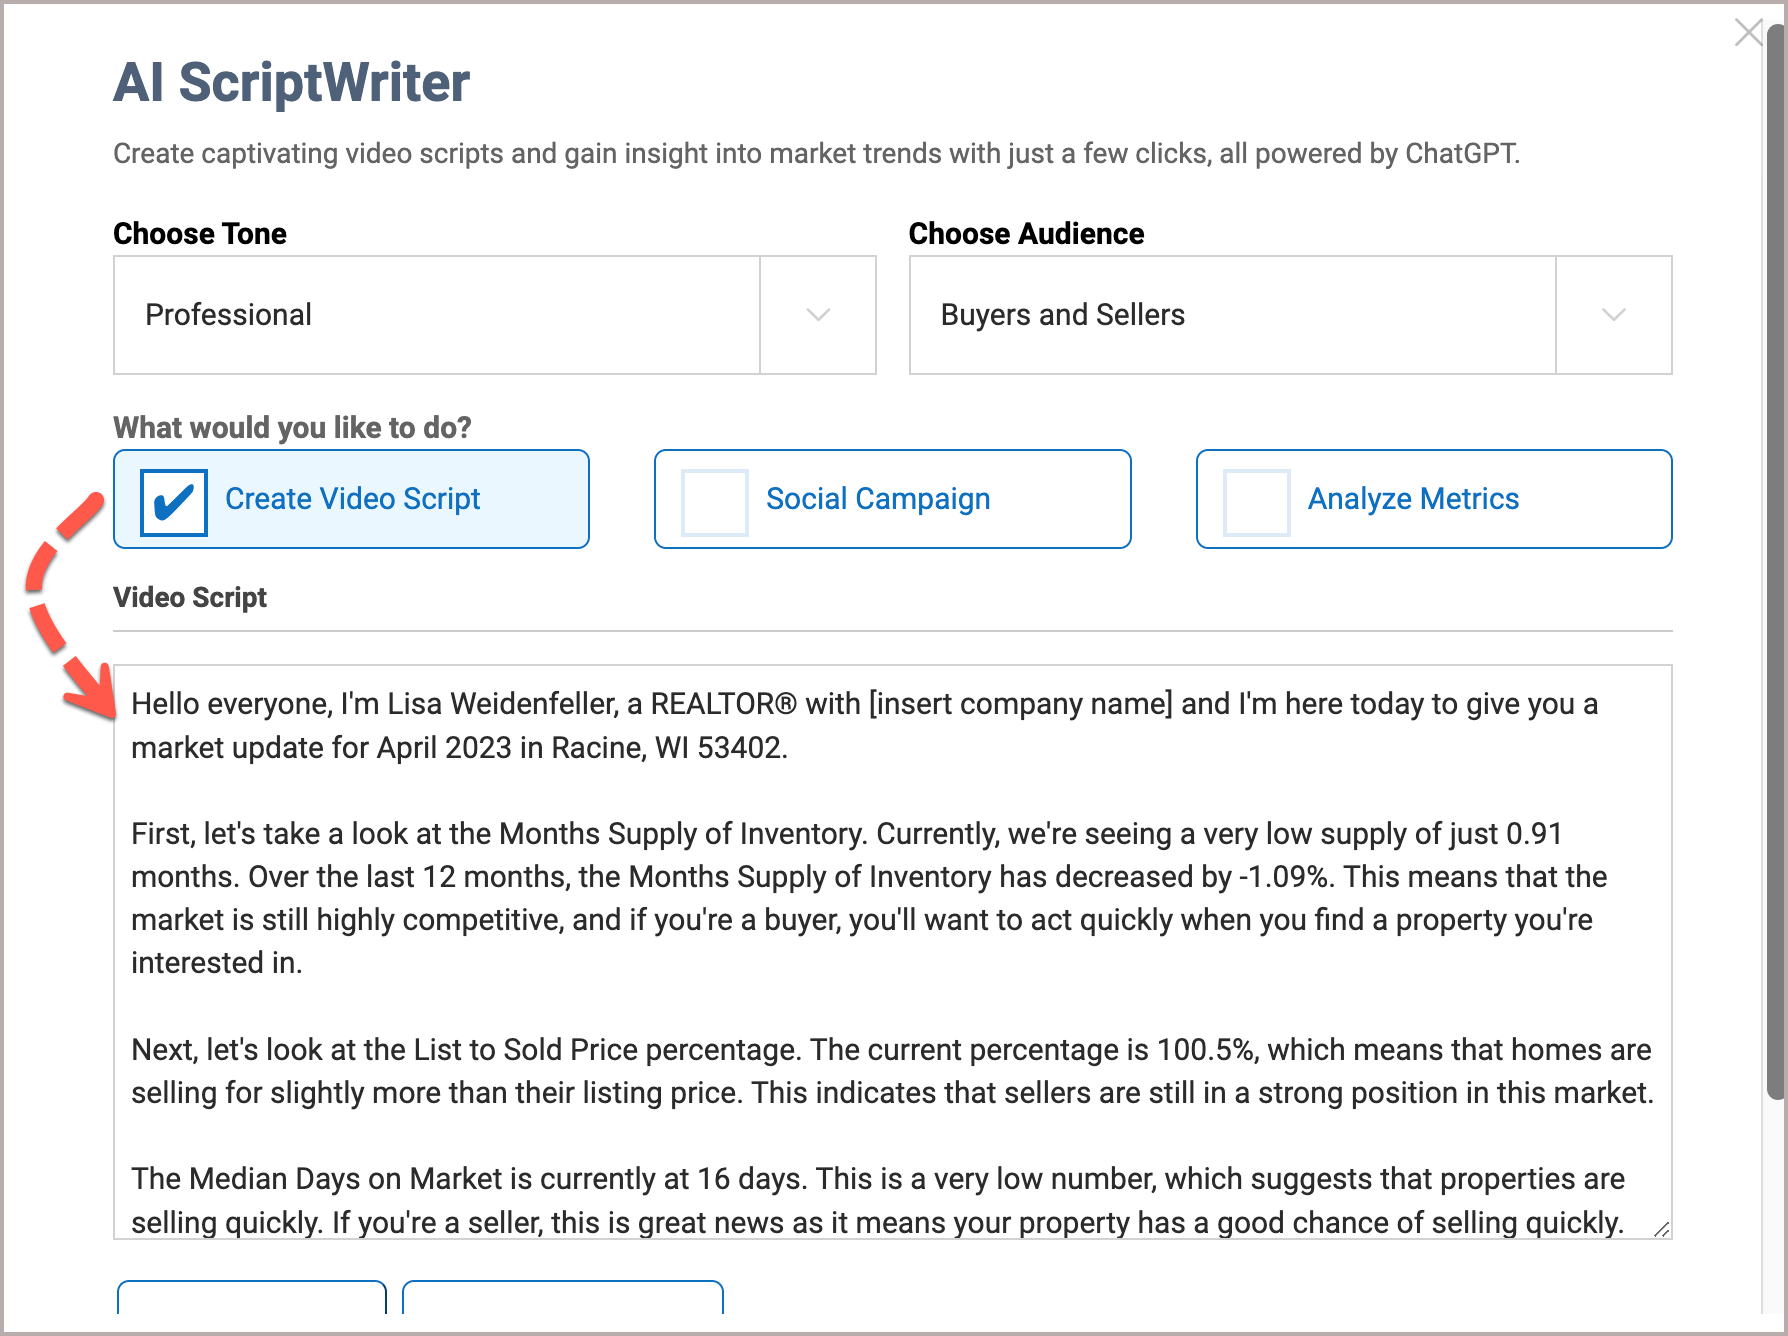
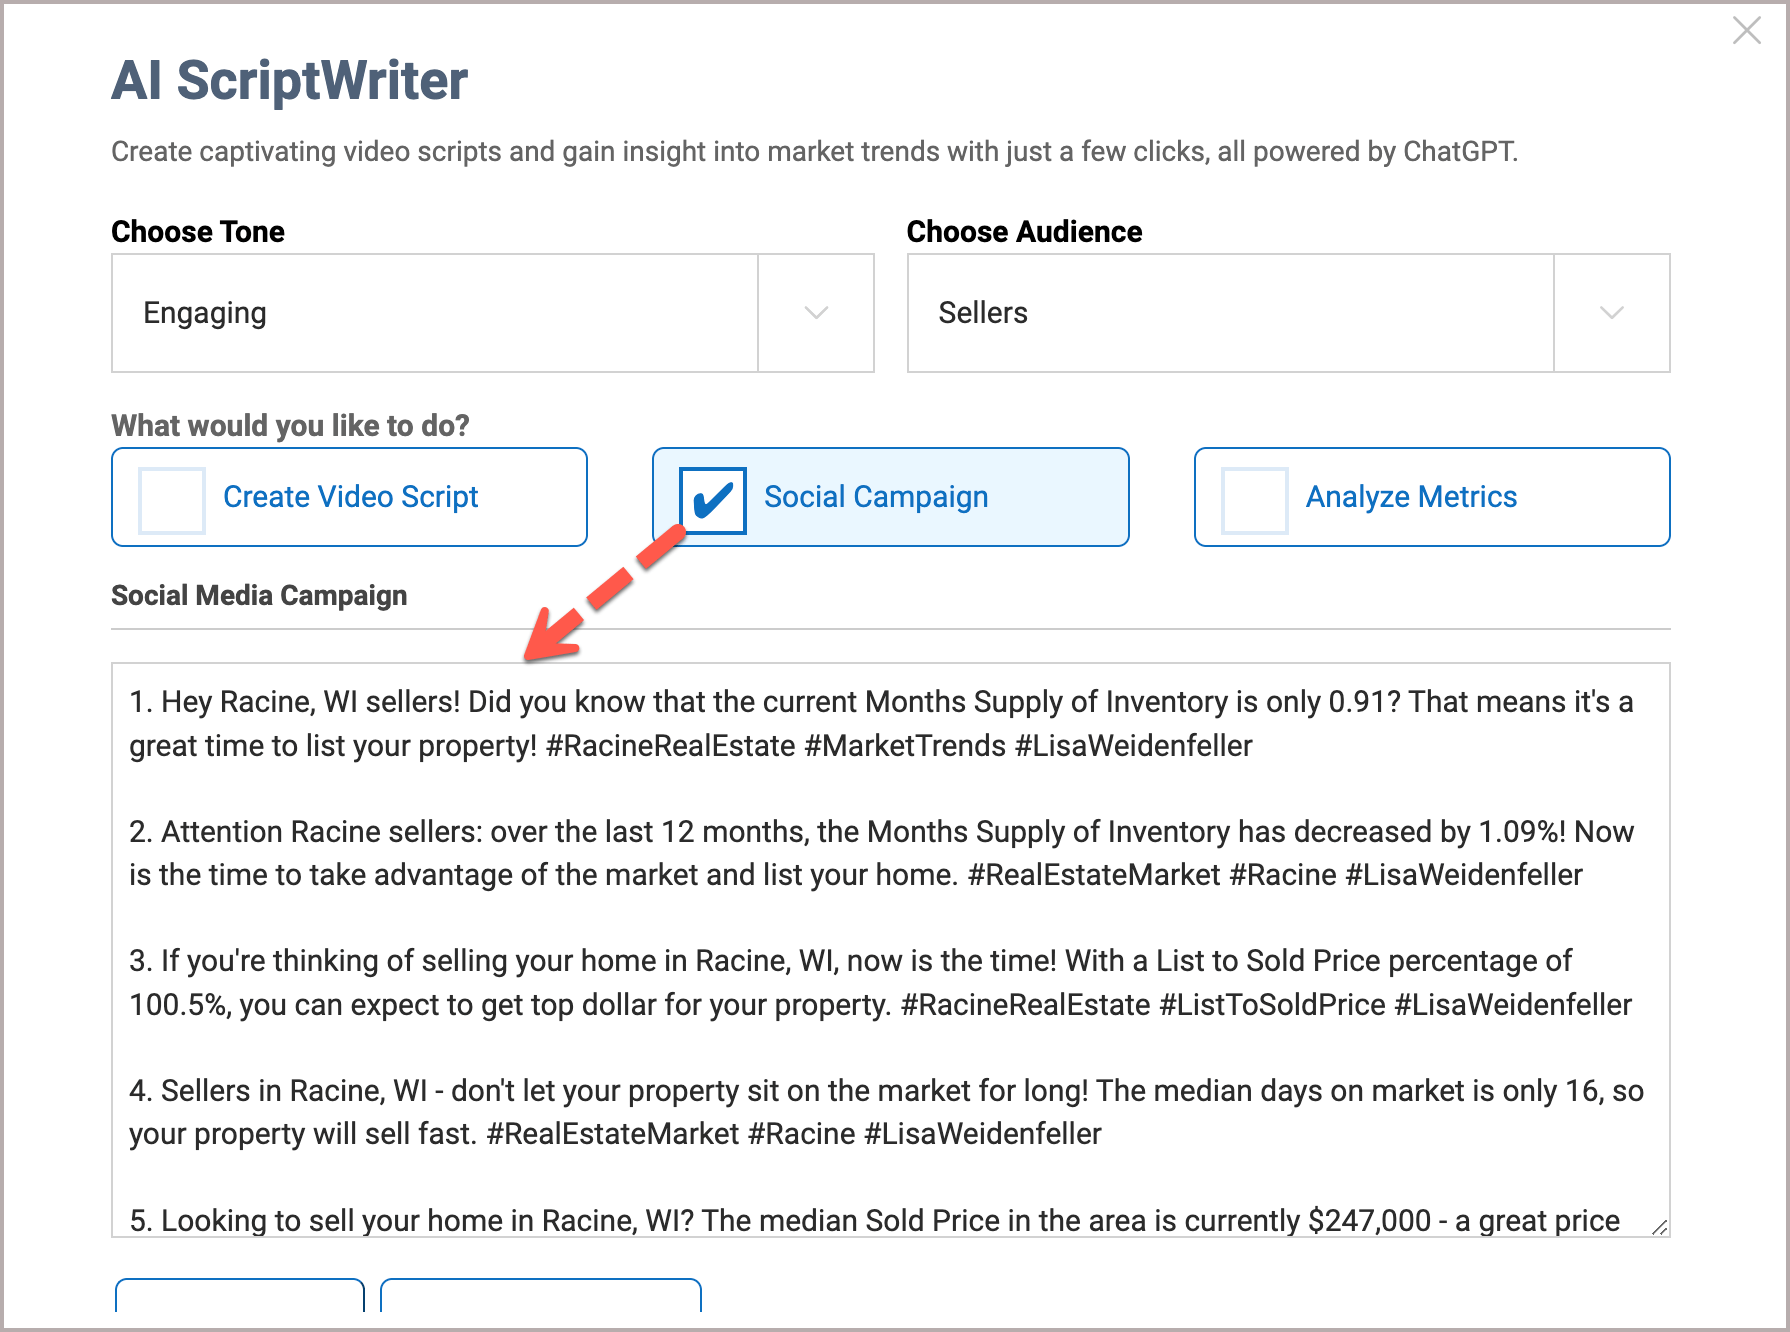
Create content to convey to your clients what is happening in a market area using generative AI software powered by ChatGPT. Choose a Tone (Professional, Engaging, or Conversational) and Audience (Buyers and Sellers, Buyers, or Sellers), then select from three script options (Create Video Script, Social Campaign, or Analyze Metrics). When finished, you can copy the content or have it emailed directly to you. Use the content in videos, Social Media posts, marketing campaigns, mailers, and more!
The Script Writer is available for the Market Trends Indicator chart that displays key metrics for a neighborhood, ZIP code, county, or city, such as Months of Inventory, List to Sold Price %, Median Days in RPR, and Median Sold Price.
You can find the Market Trends Indicator chart on the Residential Market Trends search results page, Property Information page (Market Trends tab), and Neighborhood page (Summary tab).
Neighborhood Demographics
Learn about the housing, people, economy, and quality of life in a neighborhood, city, or ZIP code.
Do you have questions about sharing demographic data with your clients?
See the NAR Code of Ethics Standard of Practice 10-1 which states: When involved in the sale or lease of a residence, REALTORS® shall not volunteer information regarding the racial, religious or ethnic composition of any neighborhood nor shall they engage in any activity which may result in panic selling, however, REALTORS® may provide other demographic information.
Frequently Asked Questions
Click on the links below
Need Help?
If you need additional assistance, contact RPR Member Support at (877) 977-7576 or open a Live Chat from any page of the website.
