Canva Templates to Help you Create Social Media Market Updates
The media narrative during a changing market does little to instill confidence. Clickbaity headlines, based on national and regional statistics, speak to recession worries, a real estate bubble and even a real estate crash. However, if you take a step back and look closely at the data, it’s clear there is much more of a story to tell.
Real estate is local, and it always has been. This is why as a real estate pro, you should use your social platforms to cut through the confusion and deliver expert local advice.
Facebook, Instagram, YouTube, and other media platforms are the perfect place to add your voice with local market insights to earn the trust of your followers. And to help on this sharing journey, RPR (Realtors Property Resource®) has the perfect solution: new housing market charts and graphs.
This collection of data, metrics and statistics is incredibly helpful in explaining local market trends. What market type are we currently in? Is housing inventory picking up? What are the month-to-month inventory changes? Are home prices softening? These are all questions your prospects and clients have on their minds.
Share Regular Market Updates to Cut Through the Confusion
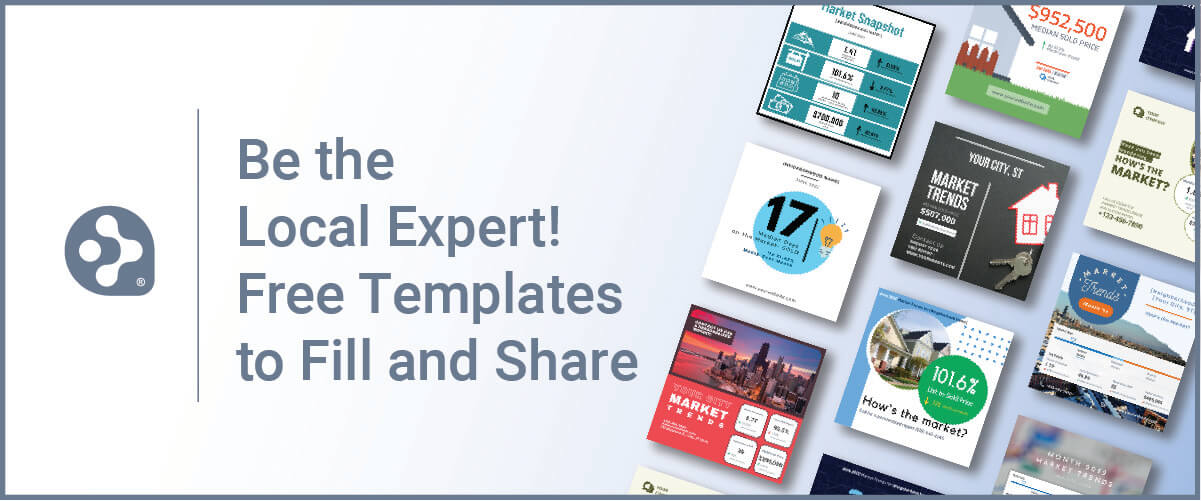
RPR reporting is not always perfectly suited for sharing on social media. For starters, there can be too much data to share on your feed at any one time. Consider picking one or two data points and adding some context around them. And to make sharing easier, we’ve created a bunch of new templates that will cut your design time in half, and still come off looking polished and professional. We’ve created these templates in Canva so you can easily apply your colors, fonts, and even images when needed, to have aesthetics that match your brand.
The How-To: Creating and Sharing Market Updates
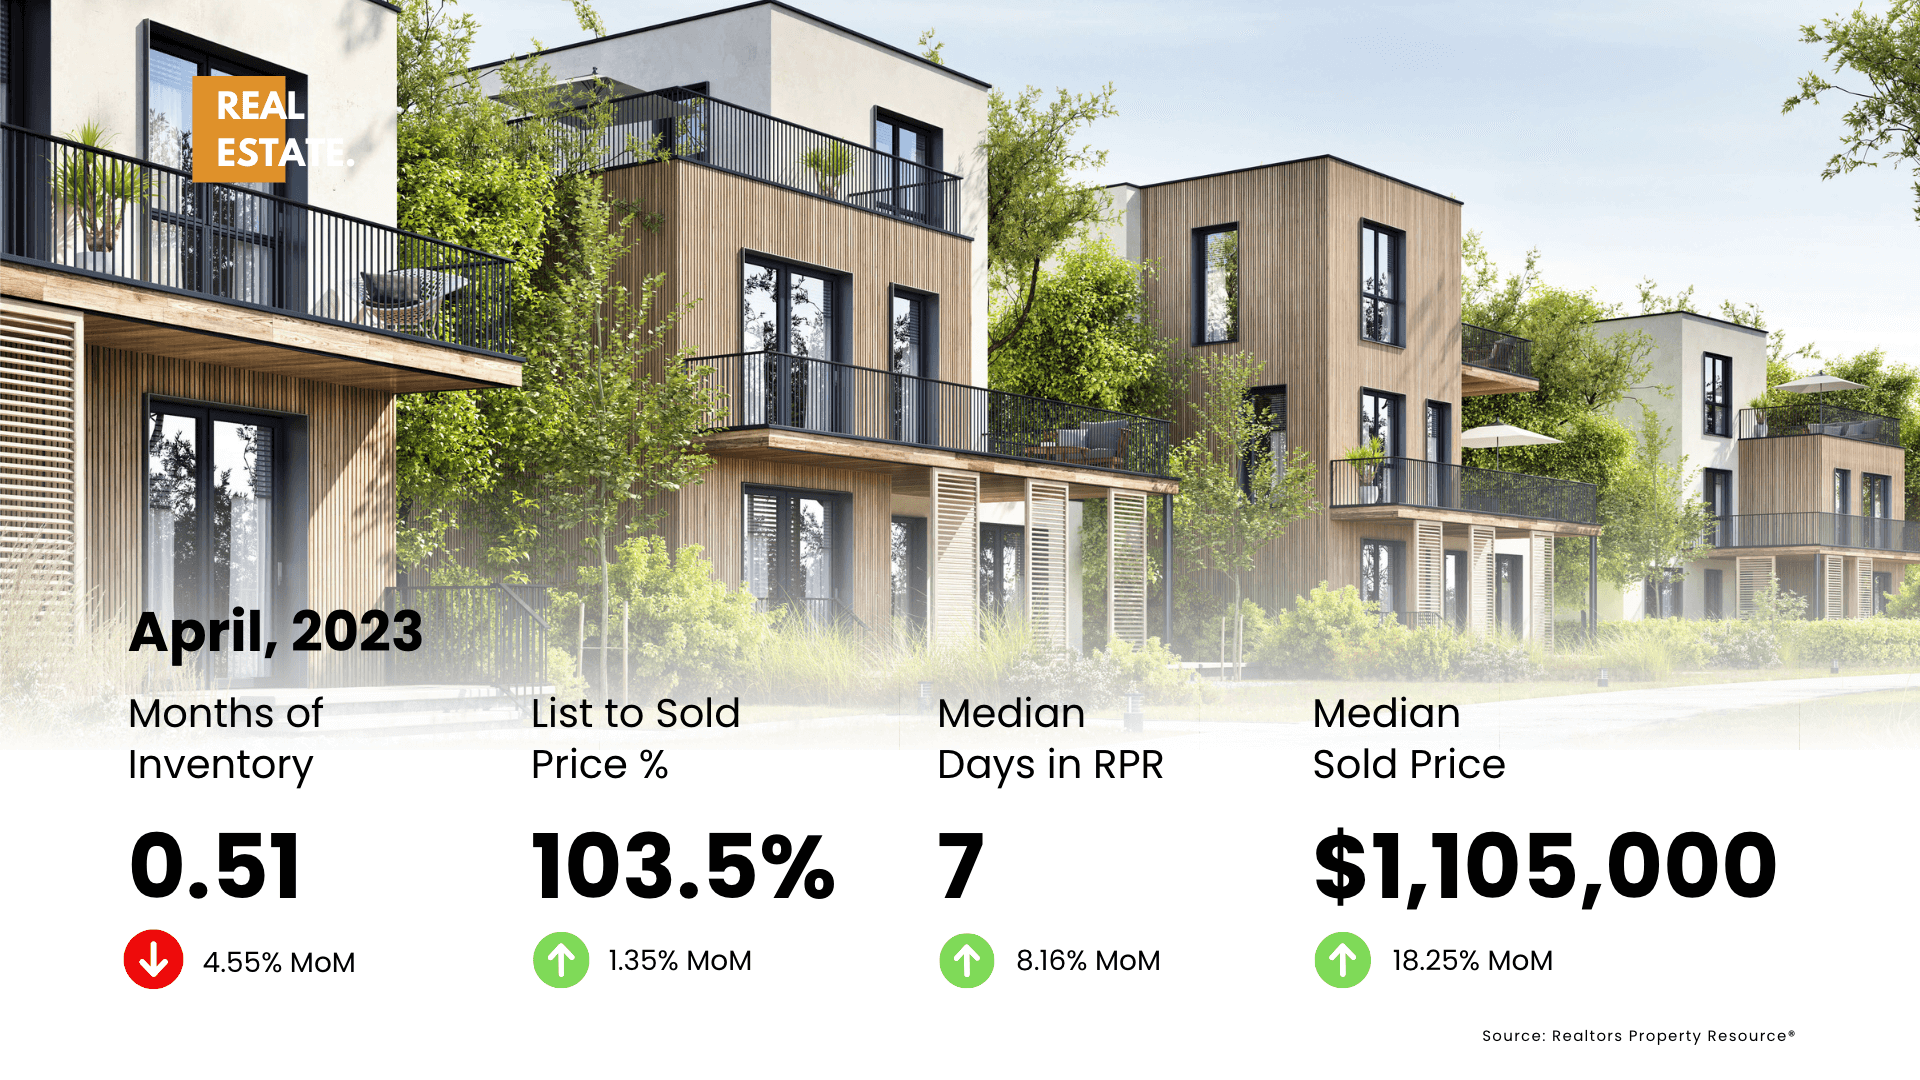
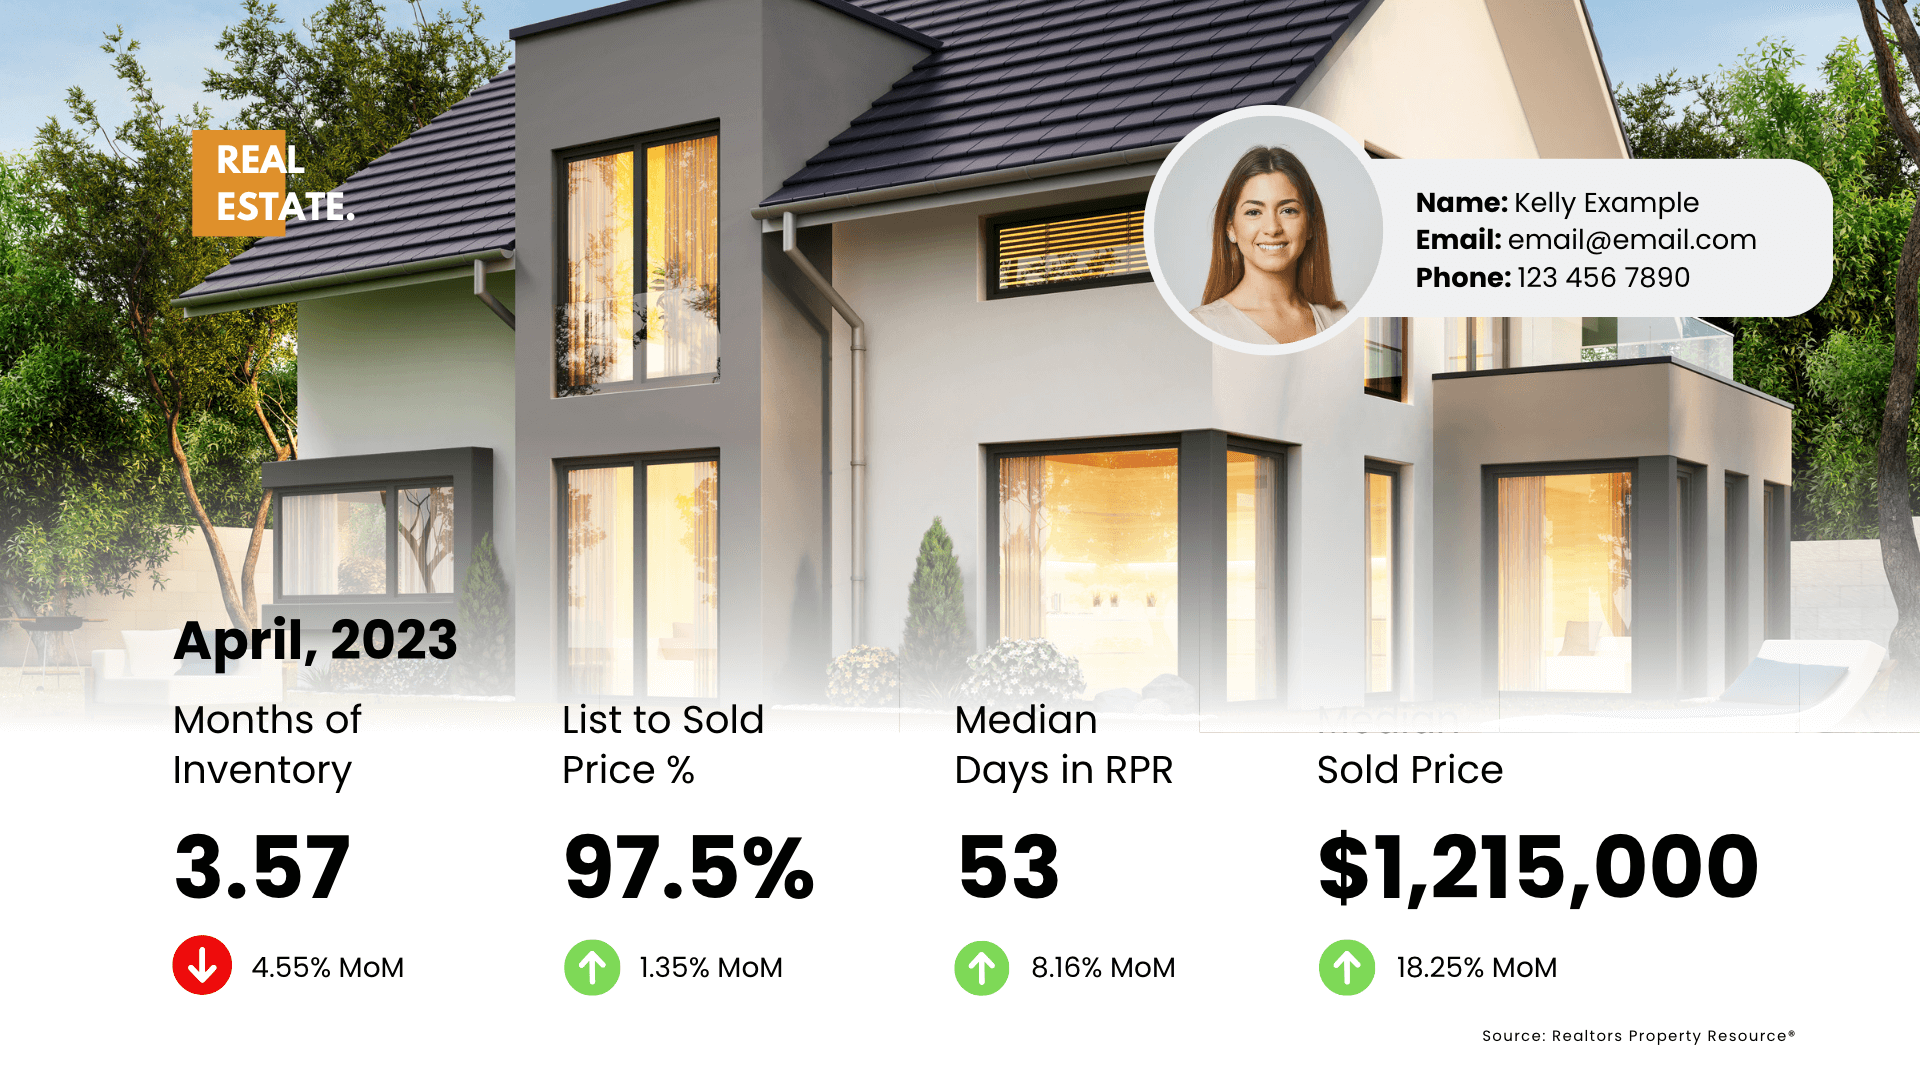
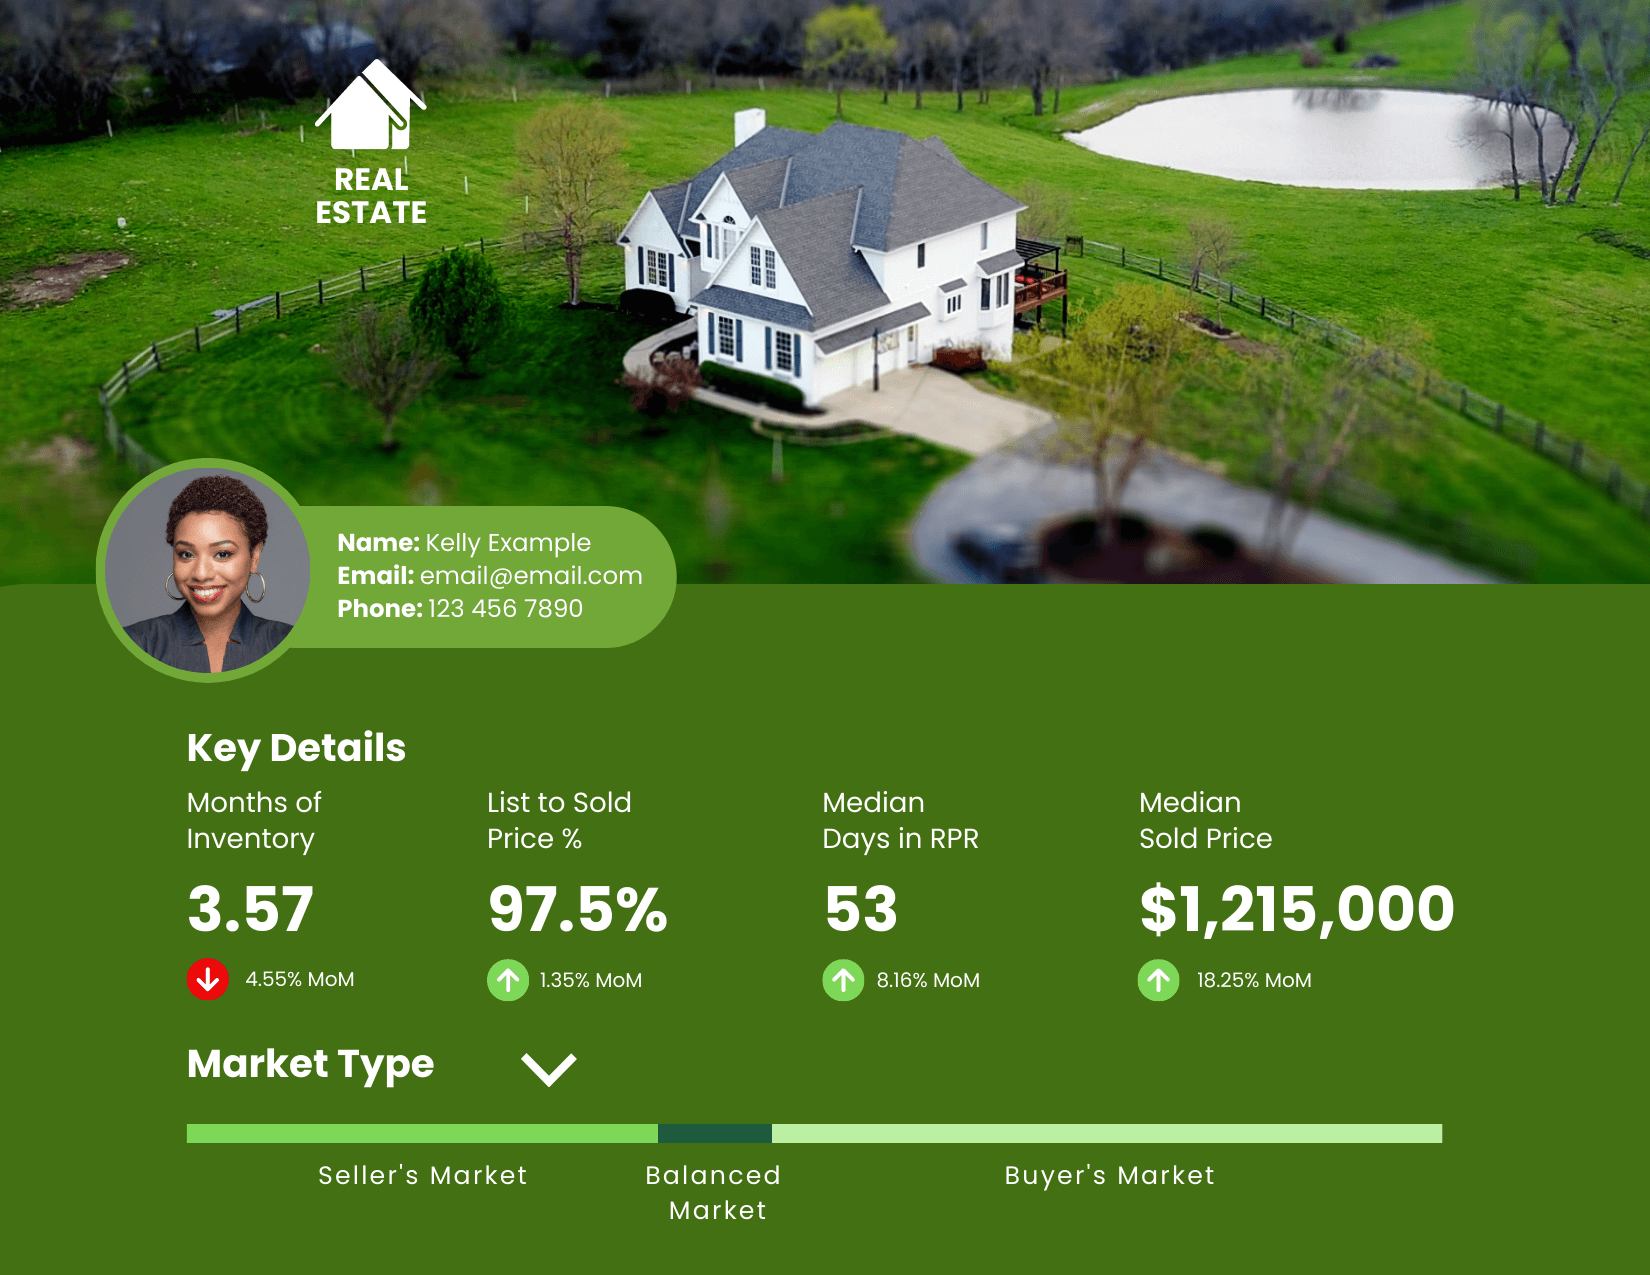
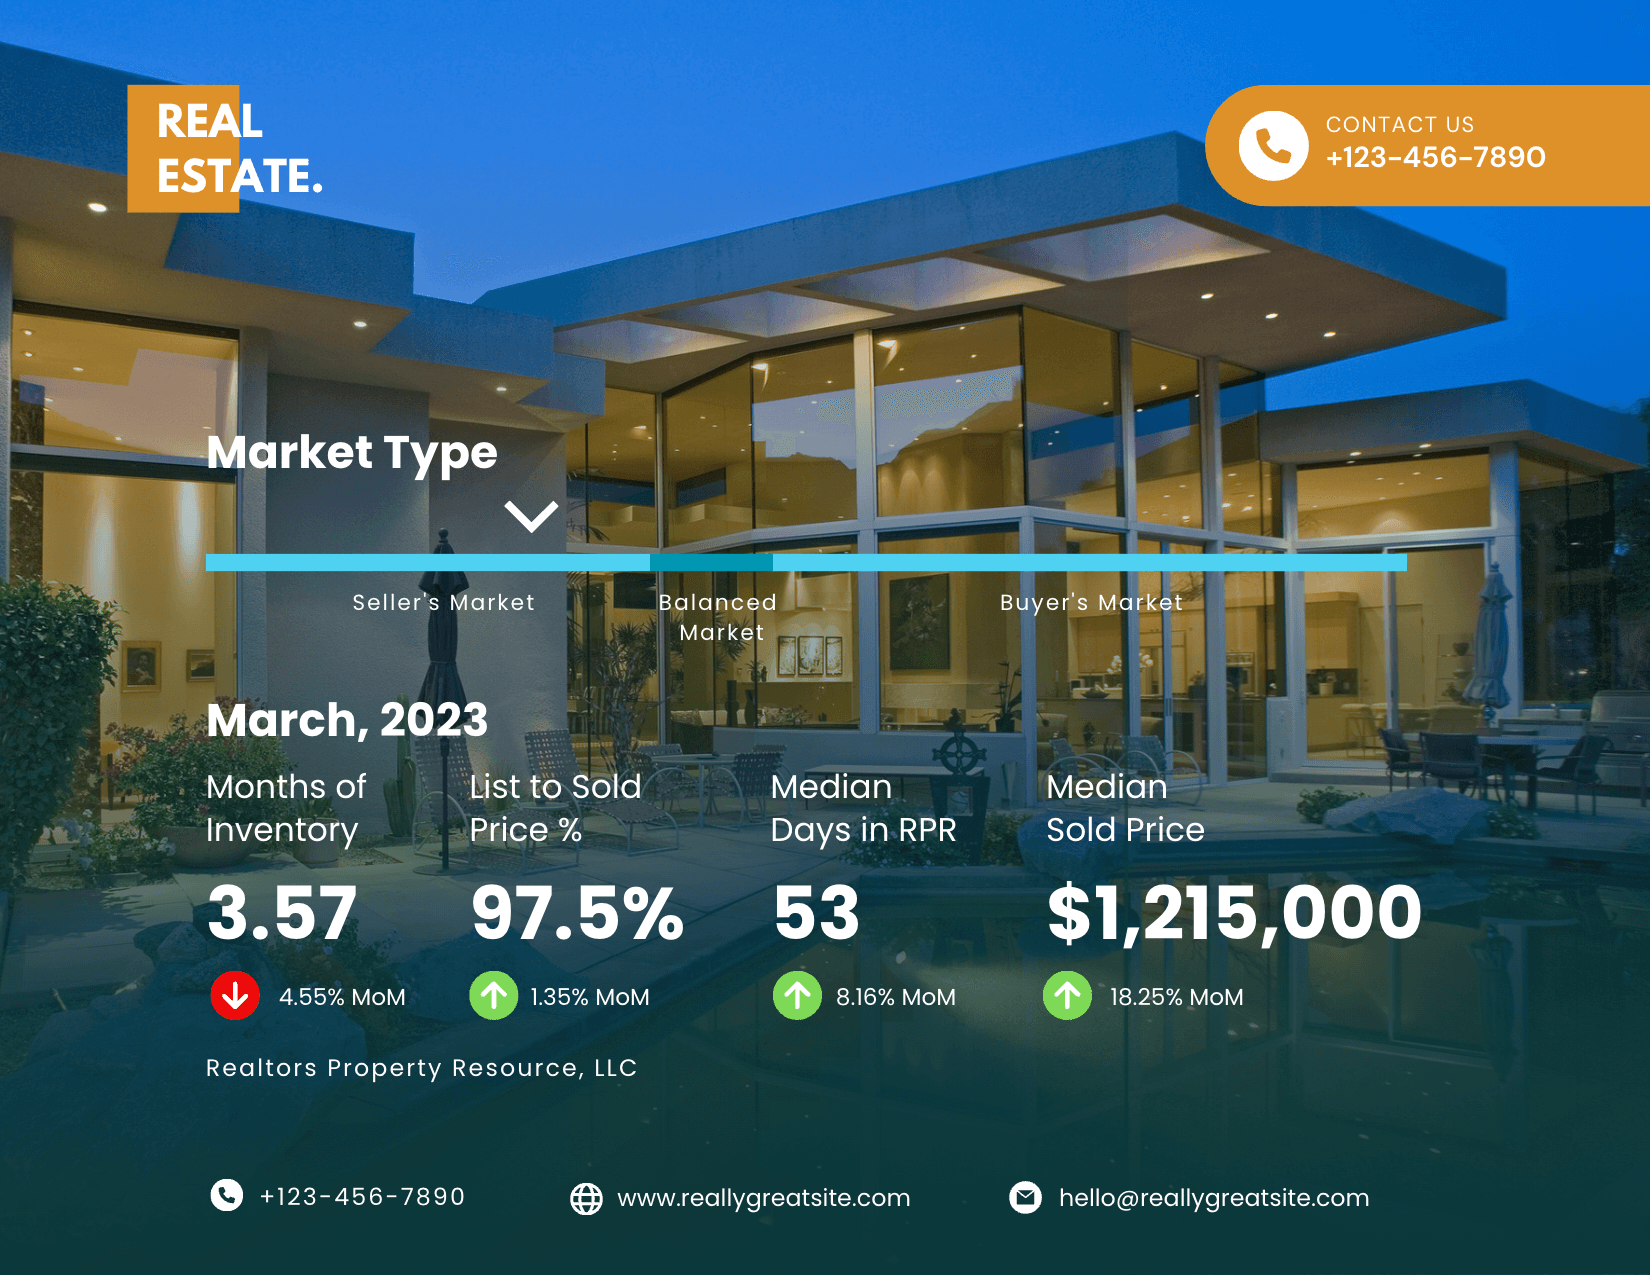
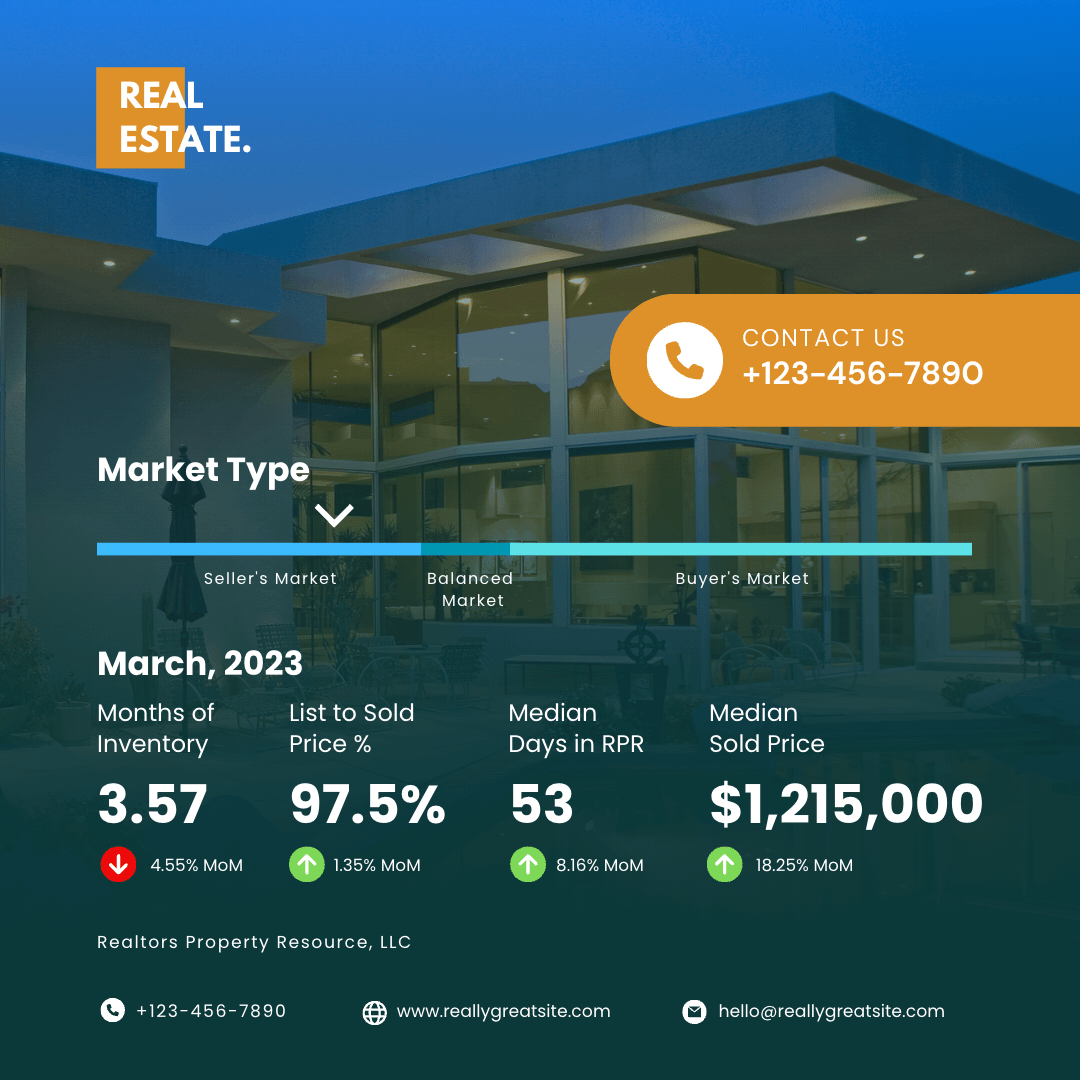
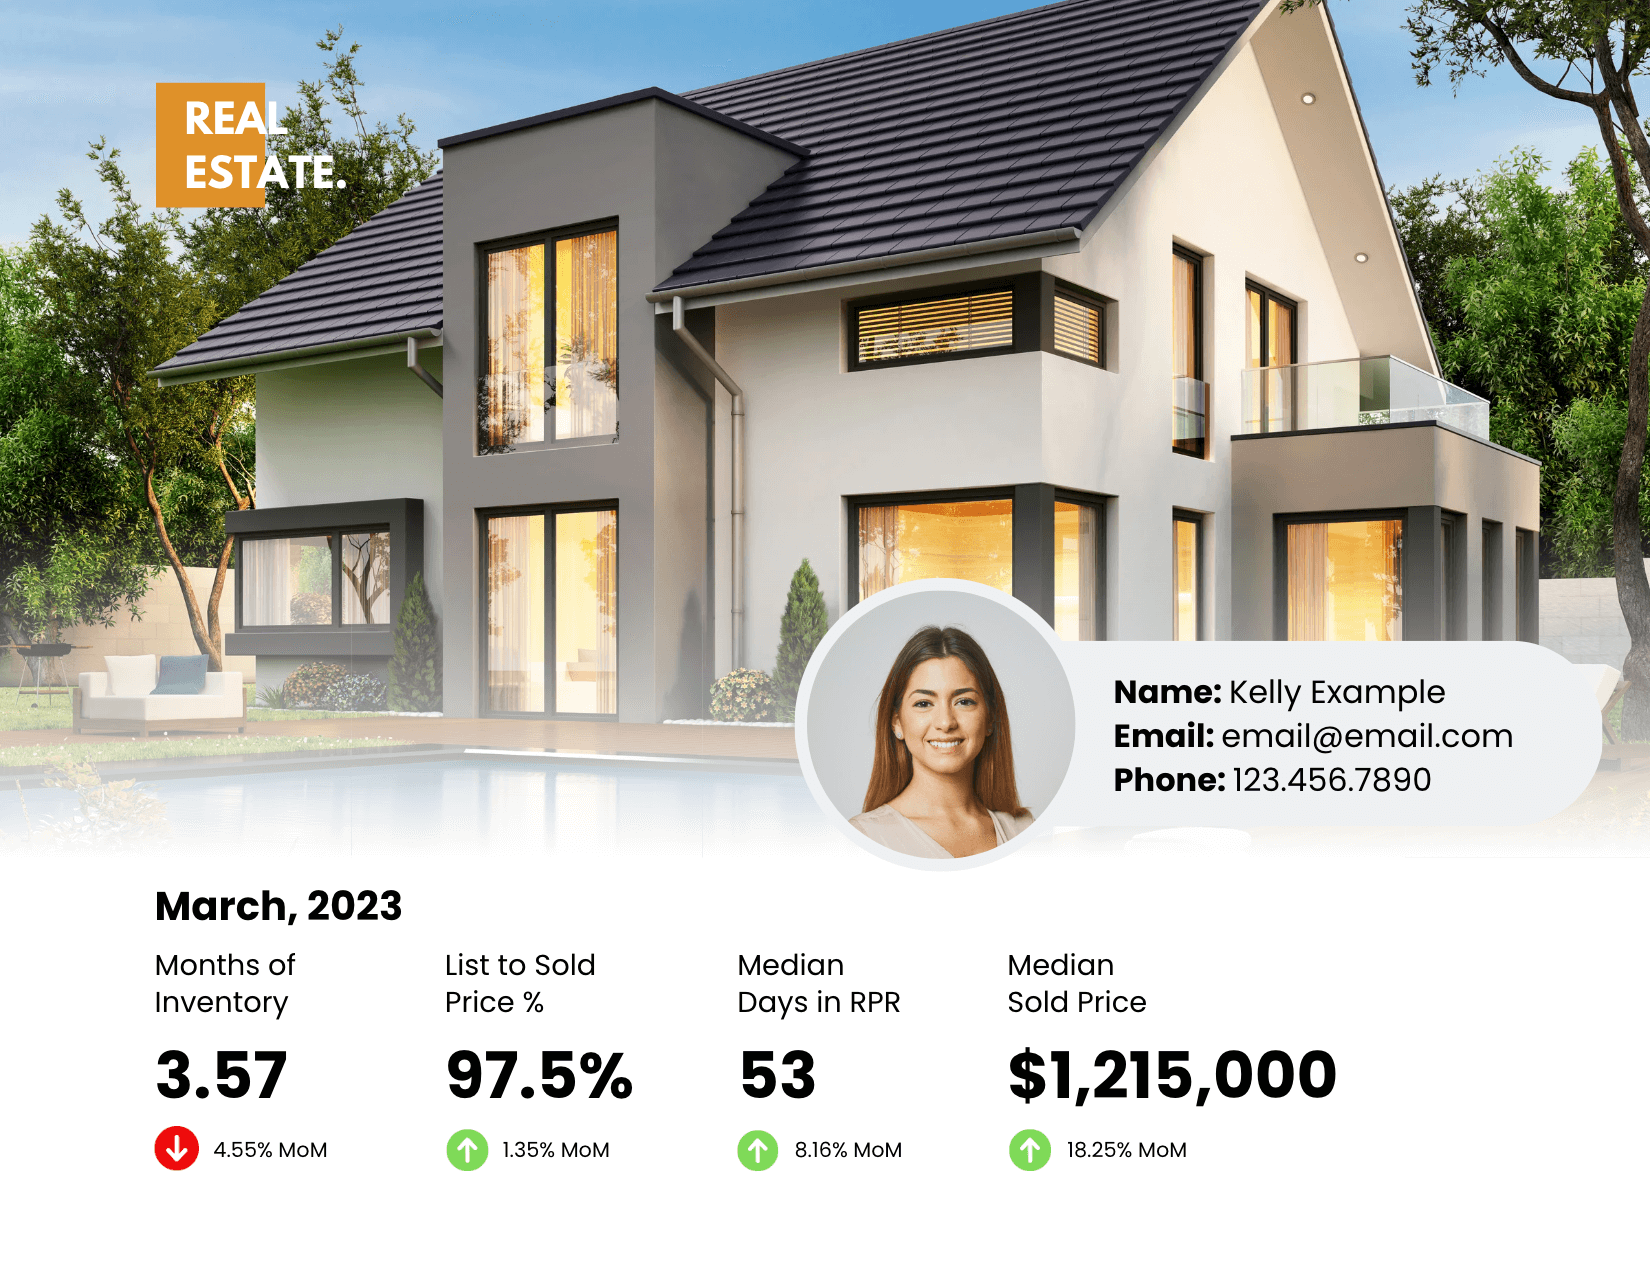
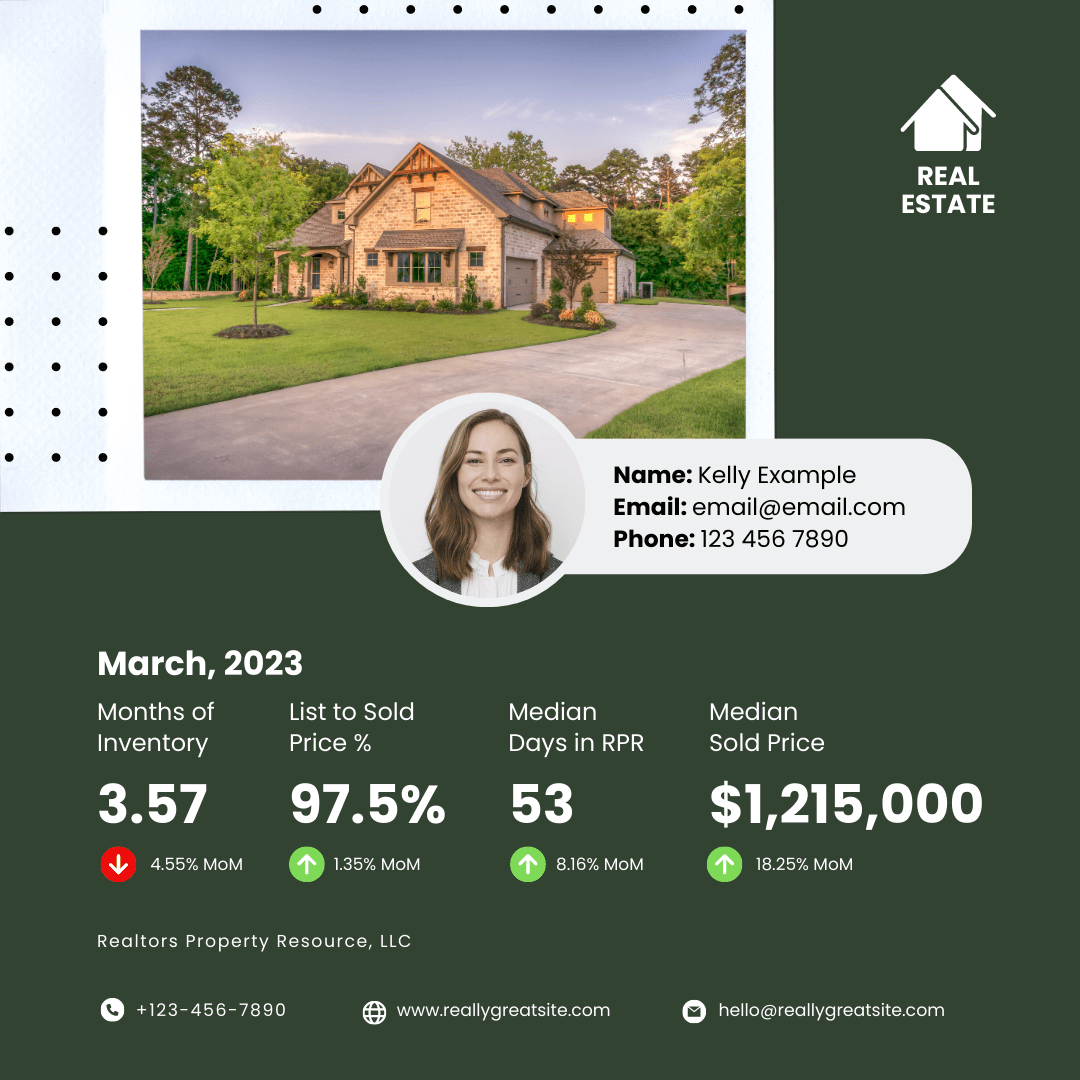
Found in RPR’s Neighborhood pages, the new Market Trends chart helps to tell the underlying story of any market starting with the type of market (Seller, Balanced or Buyer), inventory trends, list-to-sold price ratio, median days on market, and the median sold price.
Moving over to the Housing tab, you’ll get a granular view at what’s driving your local market. Here you’ll see the activity and trends are broken up by each key status: New Listings, Active Listings, New Pending Listings, Pending Listings, and Sold Listings. Rounding out this section, you can also dive into Month’s Supply of Inventory, which allows you to view inventory trends throughout the years and make any needed comparisons. Each chart is interactive, too! When you click on a tab, the chart updates with the underlying data.
Now that you understand the new datasets available to you, it’s time to deliver this important information to your sphere. Check out this collection of market trends templates that will help you showcase the data you’re sharing. Browse through and choose your favorites. They’re all professionally designed, and available via Canva.
Once you have selected a design, simply search the neighborhood you are reporting on. Now write down the current metrics you’ll be covering. For example, let’s share the Market Trends for Scottsdale AZ 85255.
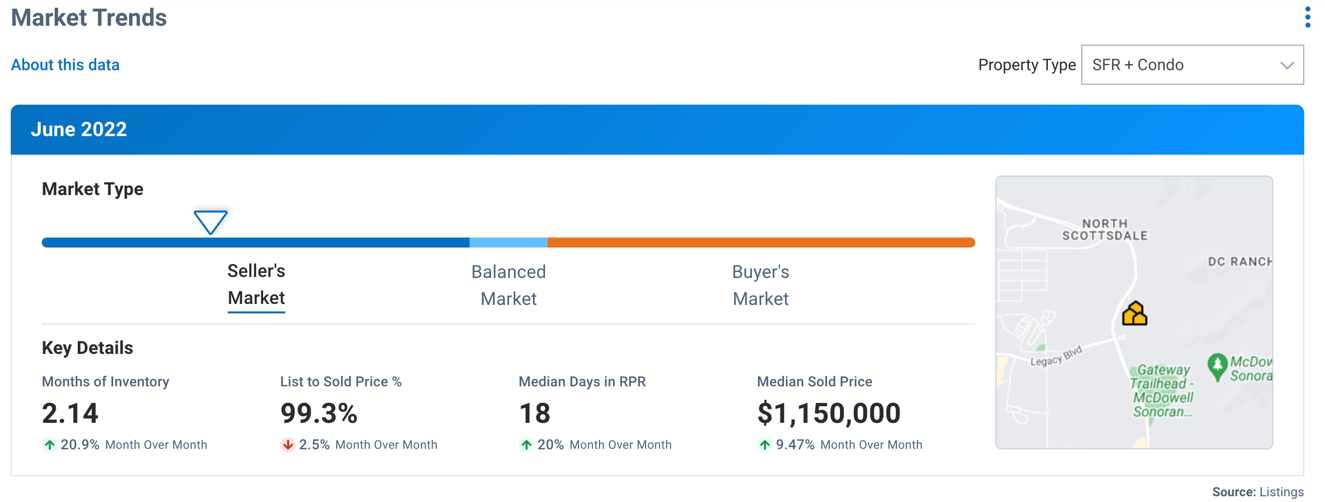
We can see the zip code 85255 has 2.14 Months of Inventory, which is up 20.9% month over month. Homes are selling slightly below list price at 99.3%, which is a decline of 2.5% since the previous month. And homes are taking around 18 days to sell, which is an increase of about 20% in the last month. And the Median Price of sold homes is hovering around $1,150,000.
With these numbers in hand, now click on the Canva template you’ll be editing and begin to enter your numbers. Also, take a moment to click on any colors and update the layout to match your brand. Once you’ve finished updating your template, click “Share” in the top right corner of Canva. Now choose “Download” and select your file type. For social media, PNG will work great. But remember you can explore different formats based on your goals.
The Wrap Up
Delivering market updates through social media is a great way to let homeowners and potential home buyers in your market know that you are a local real estate expert.
Right now, consumers have lots of questions about the market and their home values. Posting these social media market trends helps to position you as the go-to source for up-to-date information.
Share This Story, Choose Your Platform!
22 Comments
Leave A Comment
TOPICS
AUDIENCE
CATEGORIES
TUTORIALS & GUIDES
SUCCESS STORIES
PROSPECTING
THE PODCAST



How do you find the templates in the RPR site??? I’m not finding them
The article says you have to use Canva to create the templates.
From the article: ‘With these numbers in hand, now click on the Canva template you’ll be editing and begin to enter your numbers. Also, take a moment to click on any colors and update the layout to match your brand. Once you’ve finished updating your template, click “Share” in the top right corner of Canva.’
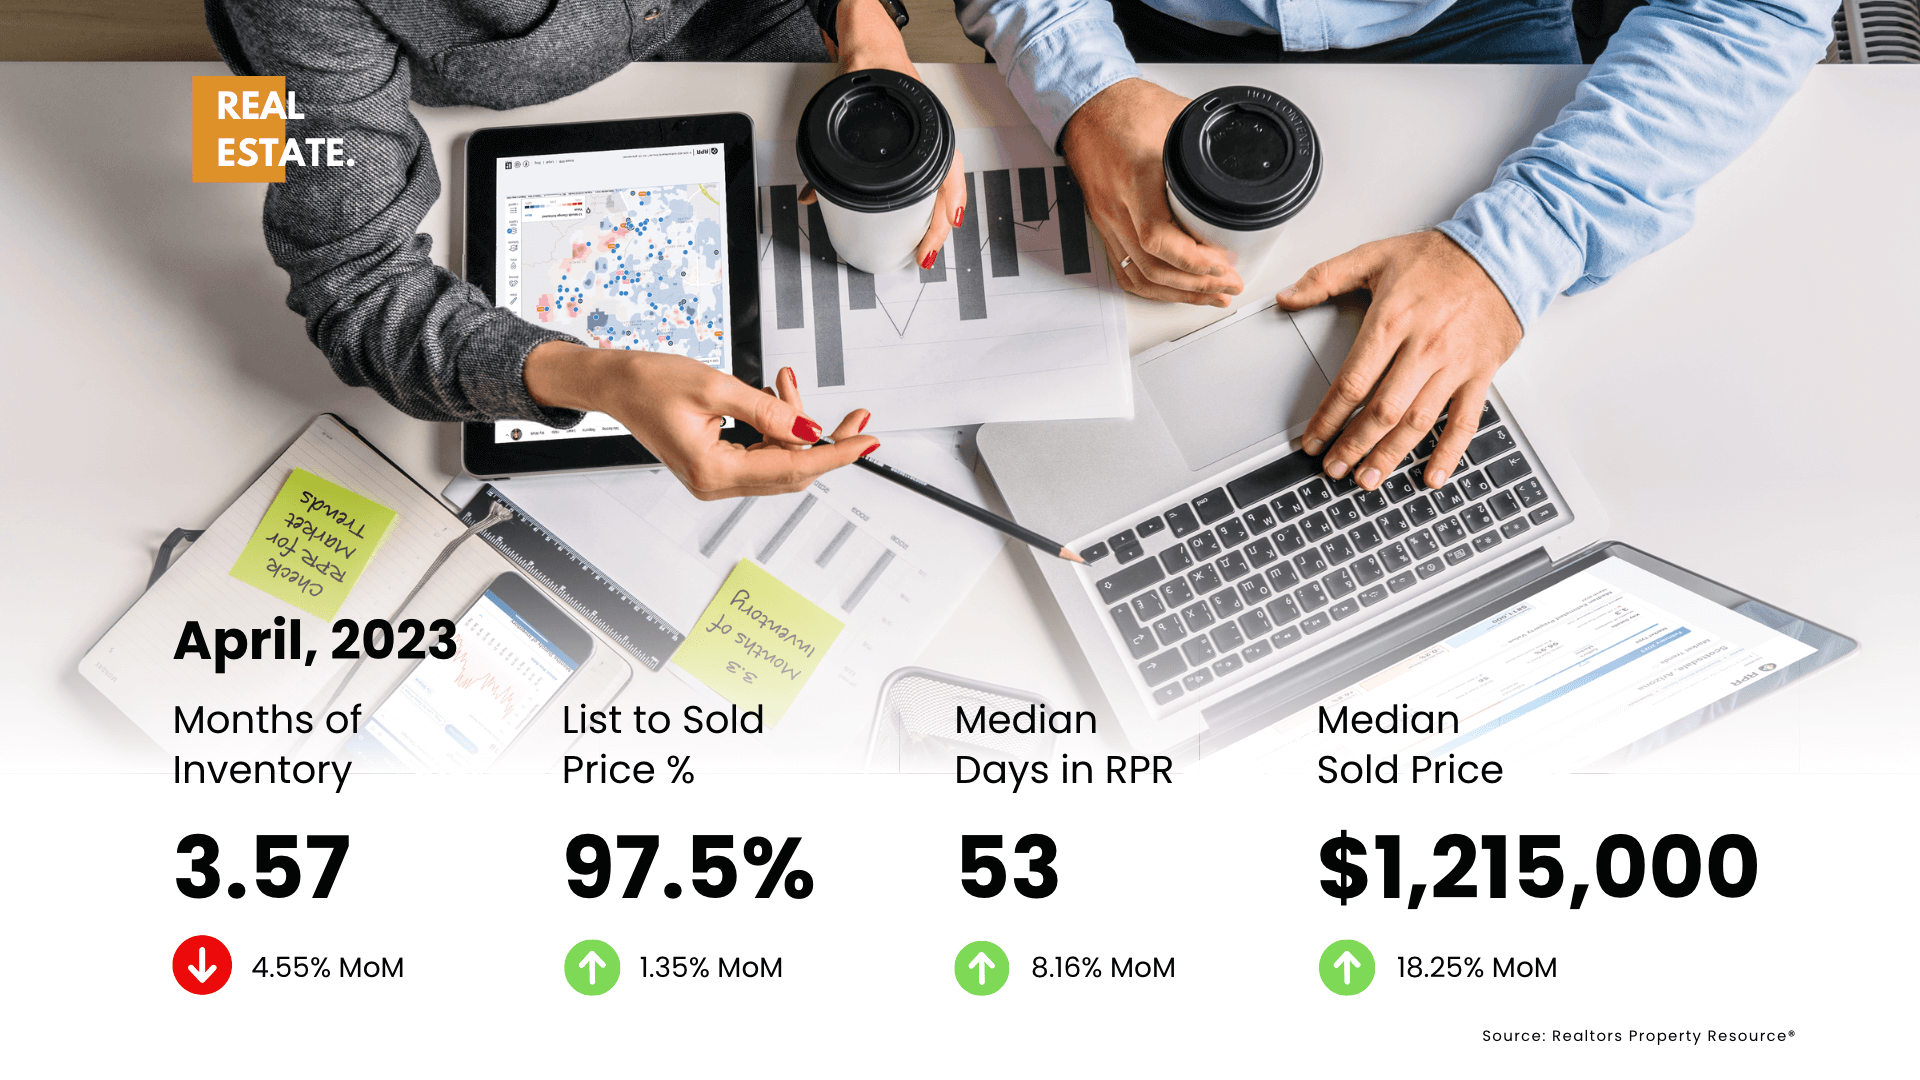
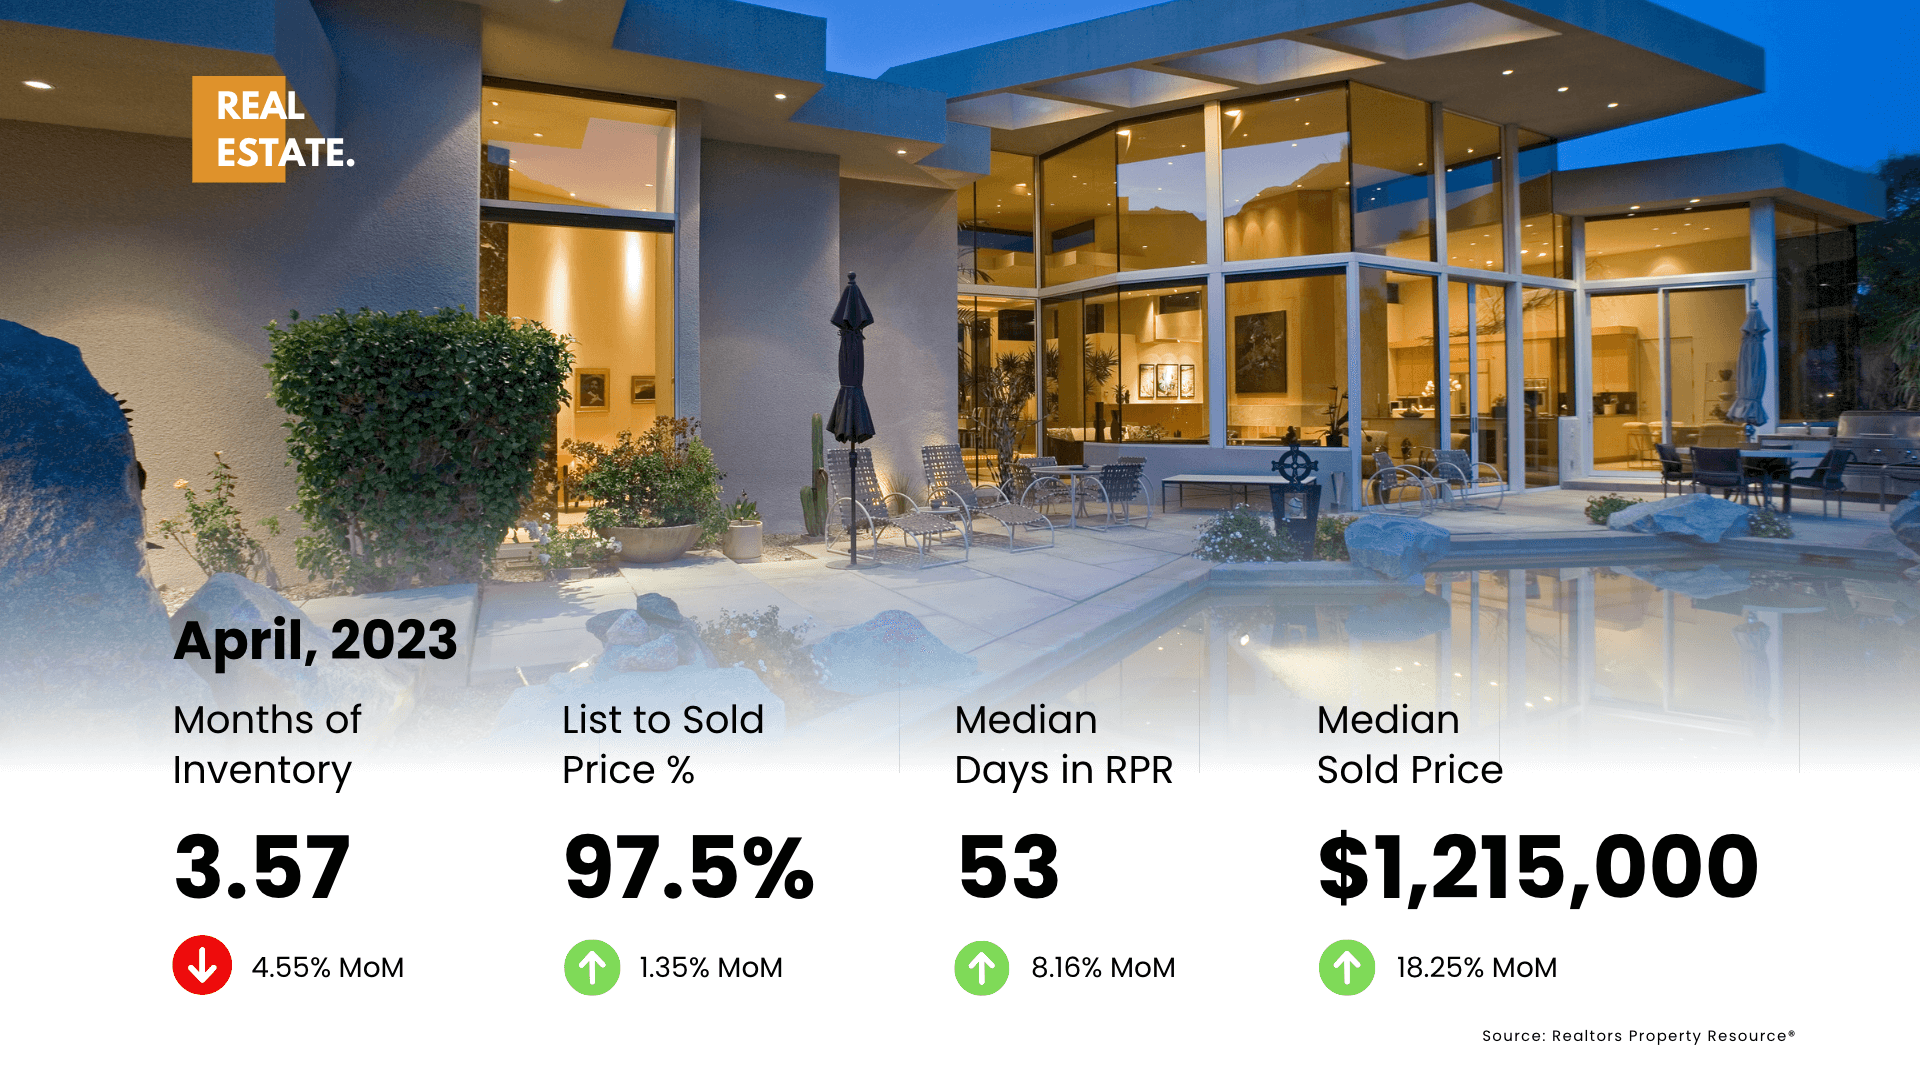
Hi Susan, the templates are in Canva. Click on the images above and you will be taken to the template. Then you can customize as needed.
Hello Reggie, how do i search on RPR so as to get the graph that goes in the canva template? Thanks.
Hi Eyeluta, Try the neighborhood search. Start with your zip code, and you’ll see the Market Trend indicator. Use your favorite screen capture program to grab the graphic and paste / upload into Canva.
So I go into Canva and the want money to remove the watermark??
So you have to have a Canva account to use these? Each time, I try to edit, it wants to verify my Canva account, which I don’t have anymore.
Hi Kimi,
We selected Canva because they do have a free account option. It’s not as feature rich as their paid version, but you can download these templates. I
when I go to share or download, Canva states you need a premium account to download or share. Are these only free to Canva premium members?
I dont see how to edit information. What am I missing?
What do we have to type in the search prompt on canva to find the templates?
Hi Pia & Francine,
To get the Canva templates, simply click on the graphics above in this post. As for the data with in RPR, do a neighborhood search and check out the Market Trends chart or the Housing tab with more charts and graphs.
[…] This content was originally published here. […]
These are amazing! Looking forward to sharing!!!
This is great! How do I get the Canva watermark removed from the graphic? I have a free Canva account, not the subscription. Do I need a paid subscription to get the watermark removed? Thanks
Thank you! I use Canva (Pro) for everything!! This is great 👍👍👍
Yes, 3 thumbs up! 😆♥️
This is awesome and thank you very much for posting these templates!!!!!!!
Hello this morning I did an online training with a gentleman from in Jacksonville, and he shared that if you hover over the Learning box Canva comes up, however, I am not seeing that same feature, is there a version of RPR that was supposed to be updated?
Hi Veronica, I think the trainer meant that if you go up to the top navigation and hover over “Learning” you’ll see the Canva Templates link. You can also go here: https://blog.narrpr.com/type/canva/
Chose a template from this post then spent time inserting the info from the RPR report. Changed colors to match my company logo etc. then when I tried to download it said it wasn’t a free template and I needed a premium account. So frustrating and waste of time. This article says the templates are free.
[…] https://blog.narrpr.com/tips/free-templates-create-social-media-market-updates/ […]
I have been using Canva for 10 years, LOVE it! Does this feature through LIBOR pull data directly from the MLS or does the Realtor need to customize it?