How Economic News Affects Your Clients’ Mindset
We see the headlines every day.
“Rising interest rates throw cold water on a hot market.” “How to prepare for the inevitable economic recession.” “Mortgage demand takes a big step back.”
Homeowners, renters and home buyers are being bombarded with these national, some might say sensational, messages on a daily basis.
Your clients and prospects hear it too, and it may be making them nervous or thinking twice about buying, selling or investing in real estate. How can you ease their apprehension and nudge them off the fence?
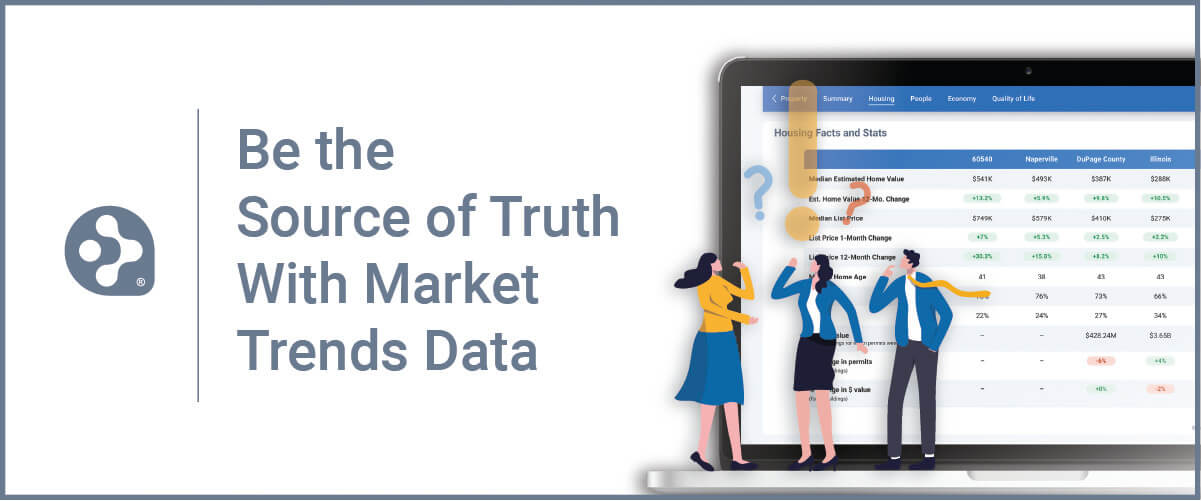
Be the source of truth, by sharing relevant, up-to-date housing data that affects their actual neighborhood or town. RPR (Realtors Property Resource) puts this type of information at your disposal so it’s easier than ever to position yourself as a local market expert.
Keep it local and keep them focused on their market’s data
National statistics, as they relate to housing markets and the economy, can be helpful in certain discussions. Housing costs and policies can shape where people choose to live, work and study, as well as their ability to move or change jobs. However, when it comes down to an individual and their situation, financially and personally, national or even regional numbers don’t tell the whole story.
That’s because real estate is local. Hyper local in reality. What’s happening in San Jose, California is definitely going to be different than Cave Springs, Arkansas. Homebuyers and sellers need the latest market trends and data in their immediate area to make informed decisions. And what’s the best thing to arm yourself with to do that? Knowledge.
Knowledge is your best friend in a changing real estate market. Here’s how RPR gives you quick access to an abundance of it…
Charts that are smart
The “Summary” and “Housing” sections of the Neighborhood details pages, and the new “Market Trends” tab on any Property Details page, are your ticket to real estate market knowledge.
Pro Tip:
To see these new charts in detail, check out this article: RPR Unveils New Charts and Graphs in its Neighborhood Pages.
These charts present local market activity, sales stats and inventory details, and package them in an easy to digest format. There’s even a slider that indicates what type of market the area is in. Here’s an example:
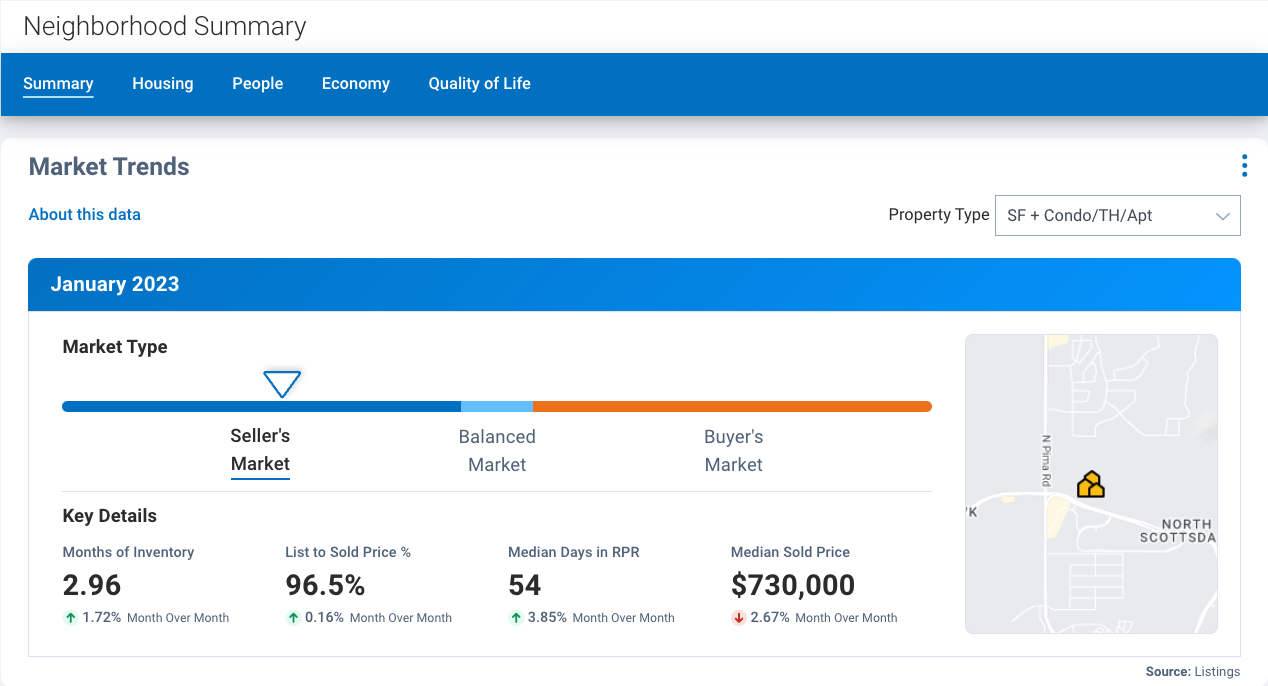
The charts are a snapshot of local market stats, including months of inventory, list to sold price, median days in RPR, and much more.
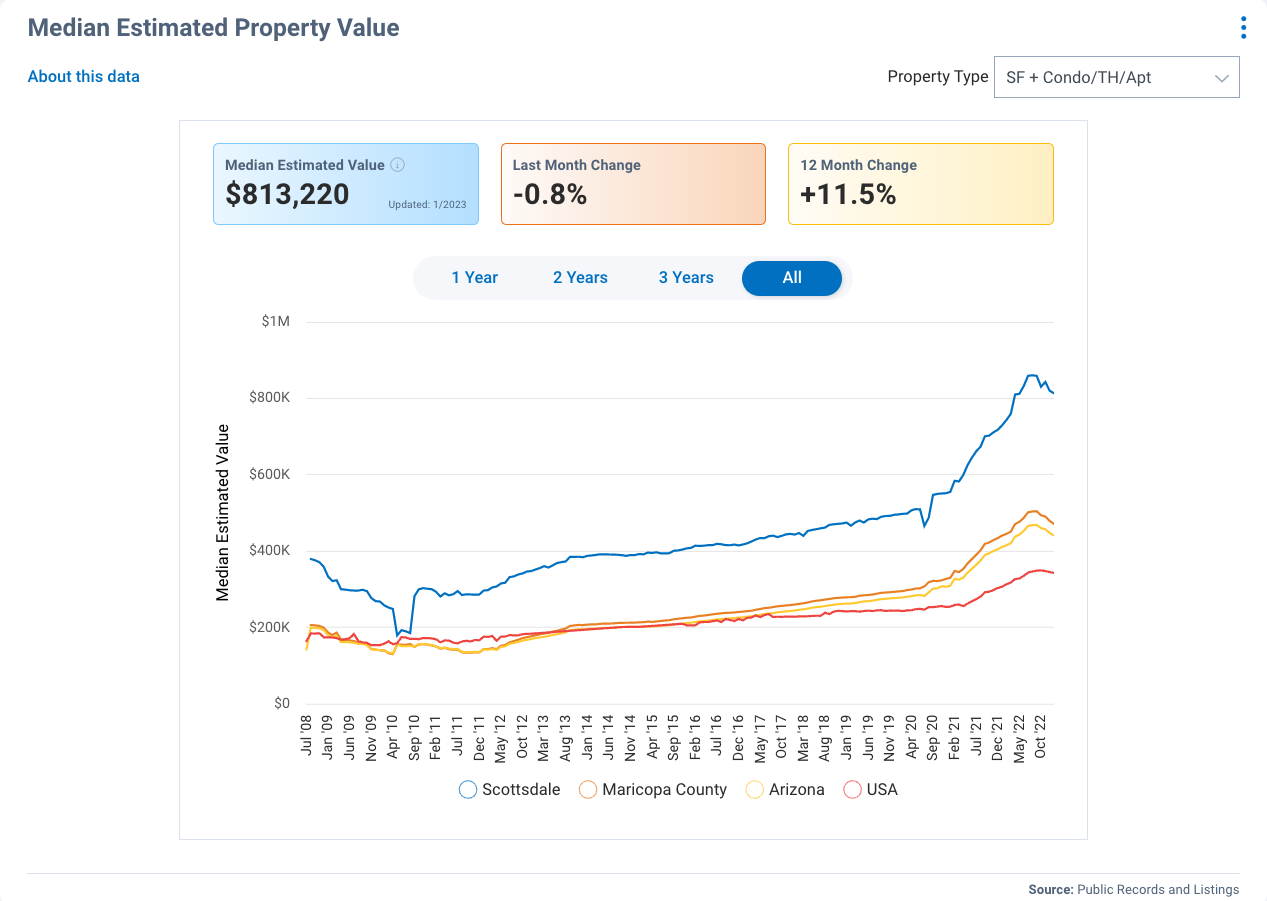
You’ll find this collection of data, graphs and statistics incredibly helpful in explaining local market trends to your buyers and sellers. It’s also an easy to understand topline that you can share with clients and prospects, which positions you as THE local market expert.
This “Market Trends” chart is something home sellers and buyers will really appreciate. You can save the page as a PDF file (through the “Print” option”) to add to reports, or make a screen grab and send them an email or text, or even post it as a graphic to your social media channels.
Get hyped!
The key to adapting and succeeding in a changing market is keeping tabs on it from a local perspective.
Gaining the knowledge and delivering hyper local market trends data is really easy, thanks to RPR’s charts and graphs. Show potential sellers that even though things have come down to earth, homes are still selling and many markets are still considered a “Seller’s Market.” Or show potential buyers inventory levels and list to sale prices.
Share This Story, Choose Your Platform!
TOPICS
AUDIENCE
CATEGORIES
TUTORIALS & GUIDES
SUCCESS STORIES
PROSPECTING
THE PODCAST
